This is Not Shorts Weather
This summer, the shorts have been wearing you. The High Short Interest Index – comprised of the 100 US stocks with the greatest short interest relative to their float, rebalanced monthly – has gained 40% since the start of June, significantly outpacing the broader market (Figure 1).
The index includes ‘meme’ stocks – companies with poor fundamentals shorted by professional investors, but pumped higher by online communities for the fun of confounding ‘Wall Street’. Most associated with GameStop at the start of 2021, Bed Bath & Beyond has been the latest beneficiary – up by 223% in the month to 15 August before retreating.
The meme crowd’s favoured weapons are options, and volumes have been increasing. Russell 3000 retail options volume had been declining from a 2021 peak above $350 billion in notional terms to around $125 billion in June and July, but jumped back to around $200 billion recently.1 Similarly, posts on the Wall Street Bets subreddit – a popular meme-trading forum – have returned to their early 2021 levels.
Enjoyable as this has been for those betting on the shorts, it has been deeply unpleasant for the professionals betting against the consensus shorts. Many Fundamental Equity Long/Short (ELS) managers are in negative territory for the year, albeit that the average ELS strategy has still outperformed equity indices (Figure 2).
Before the August surge in popular shorts, July had been the best month for ELS strategies since April 20212, but our analysis suggests that that was overwhelmingly attributable to beta. Managers have cut their gross exposure to the lowest levels since the start of the pandemic3, and have been covering their shorts rapidly.
This caution makes sense to us given the availability of short data and a community determined to act on it. We would question any manager still running high-profile short positions.
Figure 1. High Short Interest Index and S&P 500 Index Since 1 June 2022
Problems loading this infographic? - Please click here
Source: Bloomberg; as of 18 August 2022. Rebased to 100 as at 1 June 2022.
Figure 2. First-Half Performance of Fundamental ELS Managers
Problems loading this infographic? - Please click here
Source: SG Nelson and Bloomberg; as of 30 June 2022.
…And Now For The Bad News
An inflation number that finally undershot expectations led to a swift relief rally, with the S&P 500 Index leaping by around 3.5% in the immediate aftermath of the July US CPI release on 10 August. Markets welcomed the possibility that inflation may have peaked, pricing in a dovish pivot by the Federal Reserve (Figure 3) and sending measures of equity volatility to lows not seen since early April. There was also encouragement from S&P 500 earnings per share being net positive in the second-quarter earnings season, and the University of Michigan Consumer Sentiment Index rising in August. Indeed, it could even be considered a bull market, with the Nasdaq Index having retraced more than 20% from its lows.
Don’t expect the bears to go into quiet hibernation, though; they have strong grounds for mauling any positive interpretation of events. While the VIX gauge of implied volatility is retreating, realised volatility is higher (Figure 4). Second-quarter earnings were only up because of the energy sector; those companies’ earnings per share increased by 299.2% year on year, contributing 10.3% to the aggregate 6.8% gain for the S&P 500 as a whole, while earnings in important sectors like communication services, consumer discretionary and financials were down by double digits.4 Corporates also sounded more nervous on second-quarter earnings calls, with mentions of ‘better’ or ‘stronger’ falling below average relative to mentions of ‘worse’ or ‘weaker’.5
And then there’s still inflation – well above the Fed’s 2% target at 8.5%, prompting several Fed speakers to reiterate their hawkish inclinations in the days after the July print. Moreover, the latest disinflation was attributable mainly to lower energy costs; underlying inflation drivers, excluding pandemic-sensitive elements, remained robust. The recent boost from easing supply chains and cheaper fuel could also swiftly reverse given ongoing geopolitical issues. Markets aren’t getting any easier.
Figure 3. Implied Overnight Rate and Number of Hikes/Cuts
Problems loading this infographic? - Please click here
Source: Bloomberg; as of 17 August 2022.
Figure 4. Implied Versus Realised Equity Volatility
Problems loading this infographic? - Please click here
Source: Bloomberg; as of 17 August 2022.
Is Trend-Following About to Get a Lot More Difficult?
It’s no secret that trend followers have had a stellar 2022 when just about every other strategy has struggled (Figure 5). In previous weeks, we’ve written about how unusual this outperformance has been within the hedge fund landscape and why trend has been uniquely suited to this inflationary moment.
Amid a global energy crisis and record inflation, long commodities and short bonds positions have been among the largest contributors to trend-followers’ outperformance (Figure 6). But with July and August bringing the best four-week stretch for the S&P 500 since October 2021 and best four-week stretch for the Nasdaq since May 2020, it appears that trend-following may become more difficult from this point on.
Figure 5. A Great Year for Trend Followers But a Difficult Summer
Problems loading this infographic? - Please click here
Source: Man Group; as of 11 August 2022. Rebased to 100 as at 31 December 2021.
Figure 6. Long Commodities and Short Bonds Have Boosted Trend-Followers’ Cumulative P&L in 2022
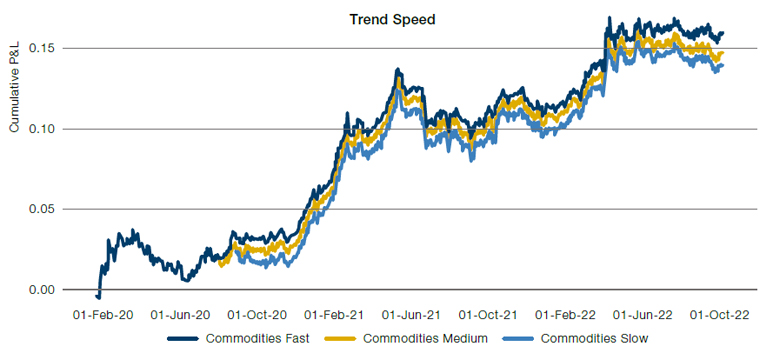
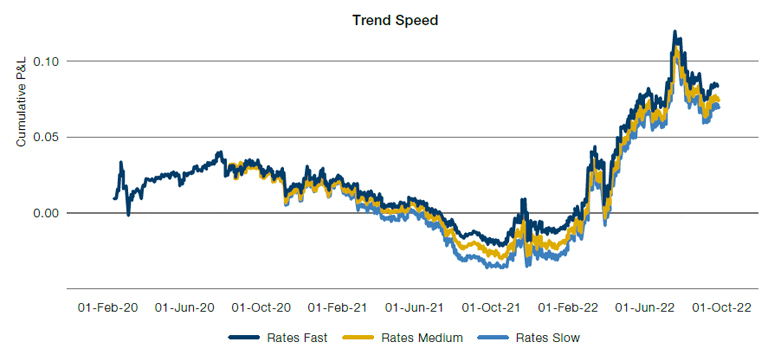
Source: Man Group; as of 15 August 2022. P&L corresponds to a simple, hypothetical trend model developed by Man Group’s Erlind Tusha.
But as these strong signals have started to reverse, trend-followers have similarly begun to shift their exposures. Equity holdings have moved longer and, while managers are still short rates and long commodities, exposures have lessened in the past few weeks (Figure 7). After a bright spring, it’s looking like a long summer of uncertainty for trend-followers; they’ll have to rely less on strong signals and more on alternative sources of alpha to maintain their high returns.
Figure 7. Equity, Rates and Commodity Exposure in Selected Trend-Following Strategies
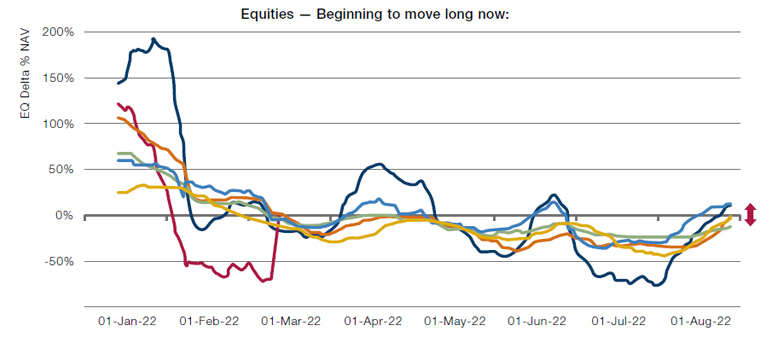
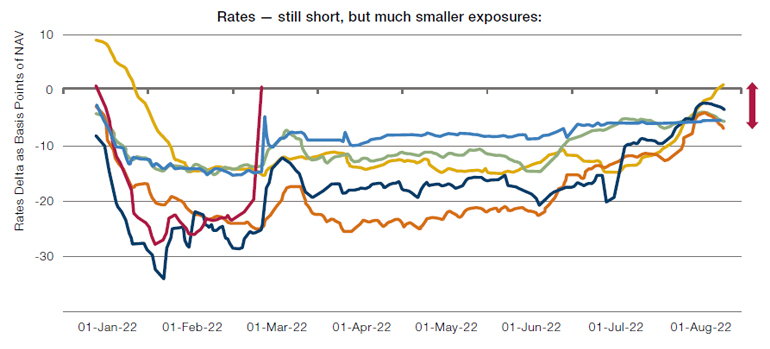
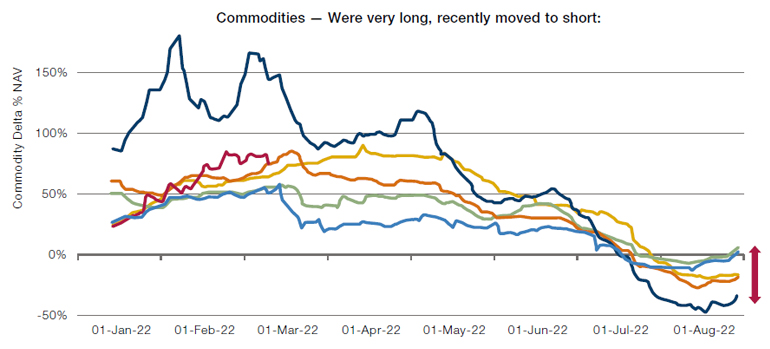
Source: Man Group; as of 15 August 2022. The lines reflect a representative selection of trend-following strategies and are intended to be illustrative of trend-following exposure in general.
With contribution from Faisal Javaid (Head of Investment Risk, Man FRM)
1. Source: Goldman Sachs; August 2022.
2. Source: Goldman Sachs; August 2022.
3. Source: Morgan Stanley; August 2022.
4. Source: FactSet and Morgan Stanley; August 2022.
5. Source: FactSet and BofA; August 2022.
You are now leaving Man Group’s website
You are leaving Man Group’s website and entering a third-party website that is not controlled, maintained, or monitored by Man Group. Man Group is not responsible for the content or availability of the third-party website. By leaving Man Group’s website, you will be subject to the third-party website’s terms, policies and/or notices, including those related to privacy and security, as applicable.