Can You Hedge a Recession With Oil?
The spectacular performance of commodities over the past year has led to some discussion about their place in a multi-asset portfolio.1 Given their correlation to equities and bonds constantly changes, can one hedge a recession with commodities?
To briefly sketch the possibilities, we illustrate the question through the prism of one commodity, oil (although, ideally, we would examine a broader basket).
During three of the last seven US recessions – in 1981, 2001 and 2020 – the oil price peaked well before the onset of recession and carried on falling. Conversely, in 1973, 1980 and 1990, the oil price peaked 6-12 months after the recession began. During the Global Financial Crisis of 2007-09, oil peaked in June 2008, several months after the US had entered recession but coinciding with the collapse of Lehman Brothers and recession in the wider world.
Such an unreliable hit rate should give investors pause about whether utilise oil as a hedge against recession; instead, we argue that investors should return to basics. What exactly is causing the recession in question?
The three instances where oil peaked after the onset of recession were during periods of high inflation (which arguably caused the recession, Figure 1). In 1973, inflation was directly triggered by price action in oil itself after the OPEC Oil Embargo. The recession of 1980 was precipitated by Paul Volcker’s decision to sharply raise interest rates to combat persistent inflation. The consequent spike in unemployment and fall in demand was therefore responsible for the recession of 1981, rather than inflation, the pace of which began to fall in 1980 itself. The same pattern is evident for the recessions of 1990 and 2008: inflationary momentum heading into the recession meant that the oil prices stayed high until general falling demand caused inflation to moderate.
The opposite relationship can also be observed. Inflation was falling before the recessions of 1981, 2001 and 2020, meaning that oil price peaked before the recession, and carried on falling during it. The most spectacular instance was in 2020. Oil peaked in 2018, after which a trade war caused a slump in demand. With inflation already low, the Covid-19 pandemic caused a deflationary shock. As demand cratered, oil futures memorably went negative.
This takes us back to a key theme in multi-asset management: correlations between asset classes and returns change depend on the inflationary regime that we find ourselves in. Instead... of assuming that a particular asset class will perform in a recession, we need to go back to the basics of supply and demand.
Figure 1. WTI Oil Versus US CPI
Problems loading this infographic? - Please click here
Source: Bloomberg, Federal Reserve Bank of St Louis; as of 21 April 2022.
The Supply Squeeze Driving US Single Family Housing
US single family housing had a stellar 2021. Prices of single-family homes rose by 18.6%, a full 14.9 percentage points above the 30-year average.2 Rents for singlefamily rentals (‘SFRs’) increased by 5.6% last year for the second year in a row, again above the 30-year average of 3.1%.2 While no-one is anticipating a repeat of such an anomalous year, a number of forecasters are predicting price growth of 8.8% and rent growth of 4.9% in 2022 (Figures 2-3).
But what is driving this price appreciation?
In our view, the reason why such forecasts seem ground in reality is the ongoing supply shortage of single-family housing. Inventory levels are at all-time lows (Figure 4). While more building permits are being issued, the US will need to see such sustained levels being maintained to make up for the shortfall since the Global Financial Crisis (Figure 5). This will necessarily take time. With the inventory shortage set to persist over the short and medium term, we would argue that the outlook for single-family housing is highly positive.
Figure 2. Median US SFR House Price Appreciation
Problems loading this infographic? - Please click here
Source: National Association of Realtors, US Census Bureau John Burns Real Estate Consulting; as of 31 December 2021.
Figure 3. SFR Rental Growth
Problems loading this infographic? - Please click here
Source: John Burns Real Estate Consulting; as of 31 December 2021.
Figure 4. SFR Home Inventory
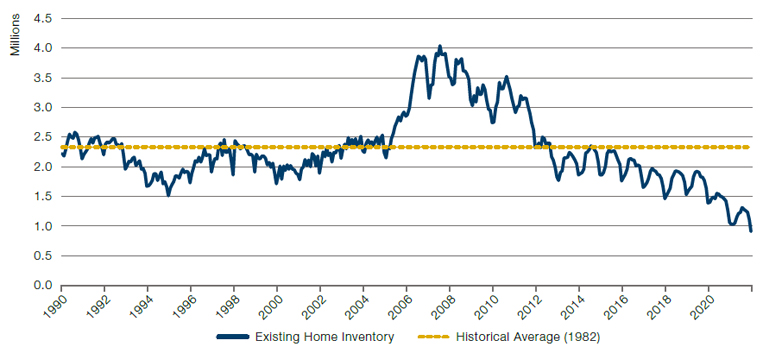
Source: National Association of Realtors; as of 31 September 2021.
Figure 5. SFR Building Permits
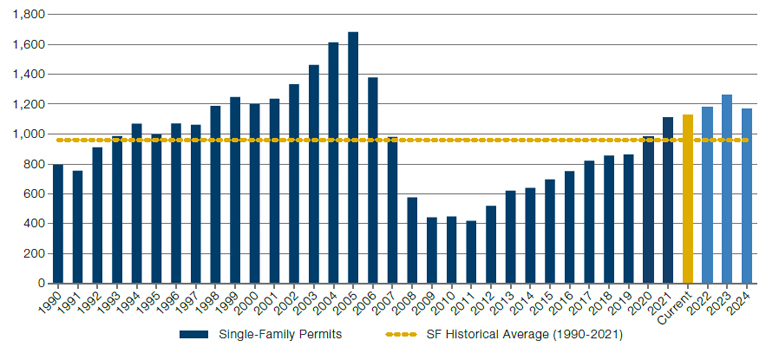
Source: National Association of Realtors; as of 31 September 2021.
With contributions from: Gilles Gharios (Man GLG, Head of Investment Risk) and Anthony Cazazian (Man GPM, Head of US Residential Real Estate)
1. A LinkedIn post by John Normand, Head of Cross-Asset Fundamental Strategy at JPMorgan, prompted an internal discussion.
2. 30-year average between 1990 and 2020.
You are now leaving Man Group’s website
You are leaving Man Group’s website and entering a third-party website that is not controlled, maintained, or monitored by Man Group. Man Group is not responsible for the content or availability of the third-party website. By leaving Man Group’s website, you will be subject to the third-party website’s terms, policies and/or notices, including those related to privacy and security, as applicable.