Yields: You’re Asking the Wrong Question
US 10-year yields stood at 2.4% on 30 March, up from a mere 1.73% on 6 March, and its highest level since May 2019.
While the move is an unexpectedly sharp response to rapidly evolving monetary policy– futures prices imply that markets now expect eight 25-basis point rate hikes by February 2023 – it also serves as a reminder of just how low yields really were. Despite the spike, we can still argue that yields are still towards the low end of a fair pricing range.
To calculate this pricing range, we decompose yields into three inputs: trend growth, inflation and the term premium (Figure 1). We then sum the values to give us a minimum and maximum range for a fair yield (Figure 2). The current US 10-year yield (illustrated by the dark blue line in Figure 2) barely exceeds the minimum fair value yield of 2.3 (illustrated by the light blue line), implying that US Treasuries are just about fairly priced based on this short-term model– albeit with significant room to move higher, given the macro inputs.
Despite the fact that real rates are negative and could reasonably be expected to creep higher over time, all of this may mean that the relentless rise in rates now takes a pause. While such a sharp selloff is painful, bond prices are simply readjusting to macro conditions. Indeed, given that inflation has been running hot for almost a year, it rather begs the opposite question: how did yields stay so low for so long?
Figure 1. Trend Growth, Inflation and Term Premium
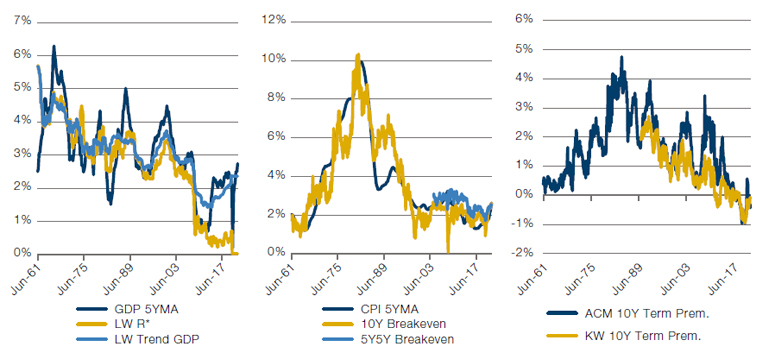
Source: Bloomberg, CFTC, Federal Reserve, Man Solutions; as of 4 April 2022.
Note: Trend growth is comprised of a 5-year moving average of GDP growth, the Laubach-Williams estimate of R* (the real neutral interest rate), and the Laubach-Williams estimate of trend GDP. Inflation is represented by the 5-year moving average of US CPI, the 10-year US breakeven rate, and the 5-year, 5-year US breakeven rate. The long-term history of the 10-year breakeven is based on a backcast by William Marshall and team and Goldman Sachs. The term premium is estimated by combining the KimWright and Adrian, Crump & Moench estimates of the 10-year term premium.
Figure 2. Fair US 10-Year Yield Versus Actual Yield
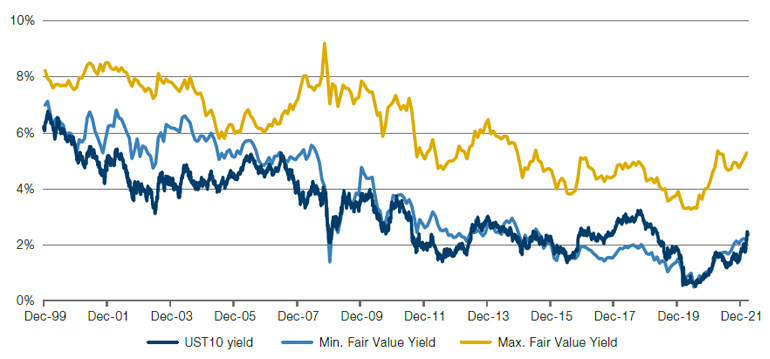
Source: Bloomberg, Man Solutions; as of 4 April 2022.
How About Value AND Growth?
For the last few years, the classic discretionary investment note has been a musing on the Value-versus-Growth debate. Is Value back? Or should we continue to buy more Growth stocks?
Here’s the kicker: we may no longer have to choose between the two.
The valuation spread – as measured by difference between the highest and lowest US equity quintiles by price-to-book ratio – has rapidly declined, and now stands at 0.31 standard deviations above the long-term average. This implies a Value outperformance: for the spread to contract, the cheapest stocks must rise in price, the most expensive must sell off or both can occur. However, at the same time, the price-to-sales ratio of the 75 fastest-growing stocks in the US is now just under three, the lowest level since 2000 providing an attractive entry point.
With Growth stocks relatively cheap, and Value stocks on a roll, could the answer to the Value-versus-Growth debate now be ‘buy both’?
Figure 3. US Large-Cap Stocks – Inter-Quintile Valuation Spread
Problems loading this infographic? - Please click here
Source: Empirical Research, NBER; as of 28 February 2022.
Figure 4. Big Growers – Equally Weighted Price to Sales Ratio
Problems loading this infographic? - Please click here
Source: Empirical Research, NBER; as of 31 March 2022.
Nickel and Liquidity
On 8 March, nickel prices more than doubled one of the world’s top producers bought large amounts to reduce its short bets on the metal (Figure 5). The increase was so dramatic that nickel trading on the London Metal Exchange (‘LME’) was halted for six trading days.
When trading resumed, the LME imposed limits on how much it would allow the contracts to move in a day (both up or down) before trading was halted again. The down limit was reached for three days in a row on very limited volume, as the LME price tried to catch up with the price of a similar contract on the Shanghai exchange which saw relatively less volatility and was never halted.
This volatility and halting of trading on the LME has some managers considering whether trading on the LME may have hidden liquidity issues. If halts in trading compromise price discovery, the LME is unlikely to maintain its position as a trading venue – which will further exacerbate liquidity issues as managers seek to trade elsewhere.
In addition to the spike in nickel prices, the market also recently saw all-time highs for other industrial metals, such as copper and aluminium, with zinc not far behind. With that in mind, we believe investors also need to think about second-order risks in equity markets, specifically stocks that have the highest beta to commodities.
Figure 5. LME 3-Month Nickel Versus Shanghai 1-Month Nickel
Problems loading this infographic? - Please click here
Source: Bloomberg; as of 4 April 2022.
With contribution from: Teun Draaisma (Portfolio Manager, Man Solutions) and Jonathan Daffron (Deputy Head of Investment Risk, Man FRM)
You are now leaving Man Group’s website
You are leaving Man Group’s website and entering a third-party website that is not controlled, maintained, or monitored by Man Group. Man Group is not responsible for the content or availability of the third-party website. By leaving Man Group’s website, you will be subject to the third-party website’s terms, policies and/or notices, including those related to privacy and security, as applicable.