Who Will Pay For US Fiscal Spending?
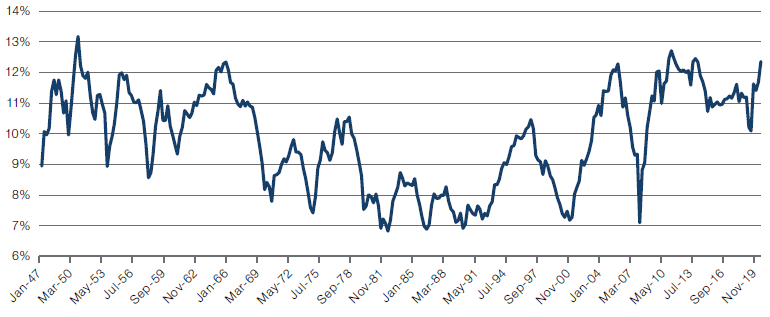
Corporate profits as a percentage of US GDP are back towards all-time highs (Figure 1). But could President Biden’s proposed infrastructure bill herald the end of this corporate arcadia?
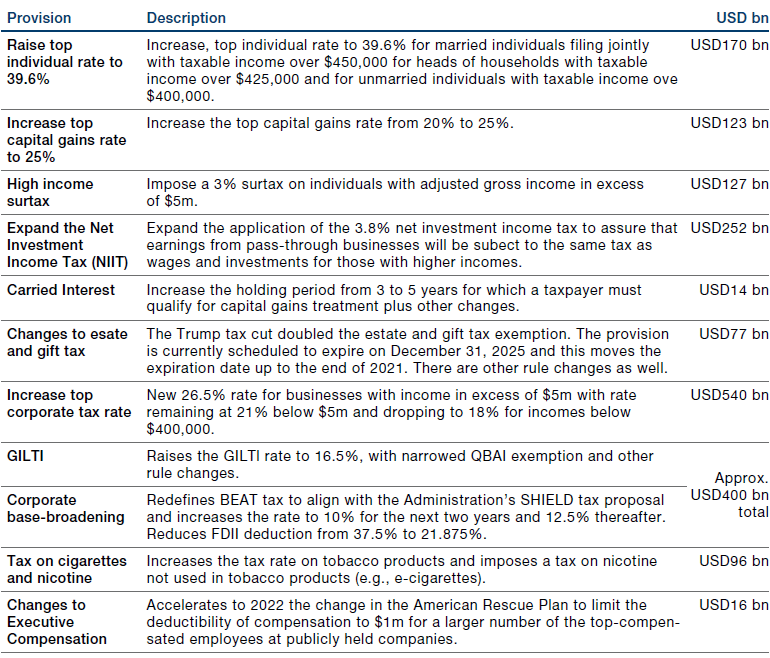
Proposals from the House Ways and Means Committee indicates most of the revenue raising burden will be directed at corporations (Figure 2). Around USD940 billion of the proposed tax hikes are directed at US corporations, including an increase of corporate tax to 26.5% for those businesses with an income of over USD5 million – although it doesn’t specify whether this is top-line revenue, operating or net income.
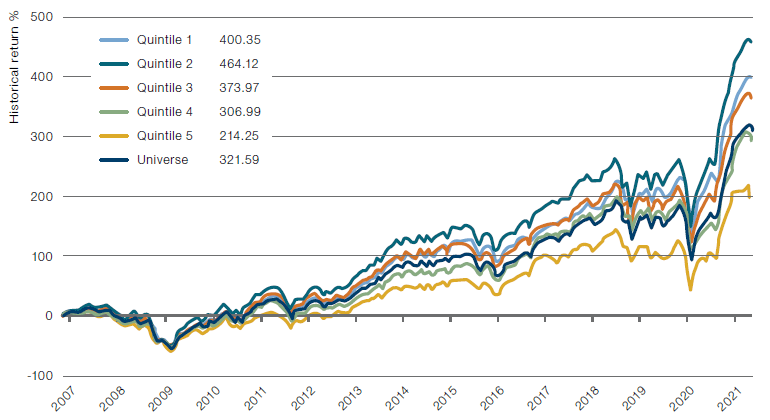
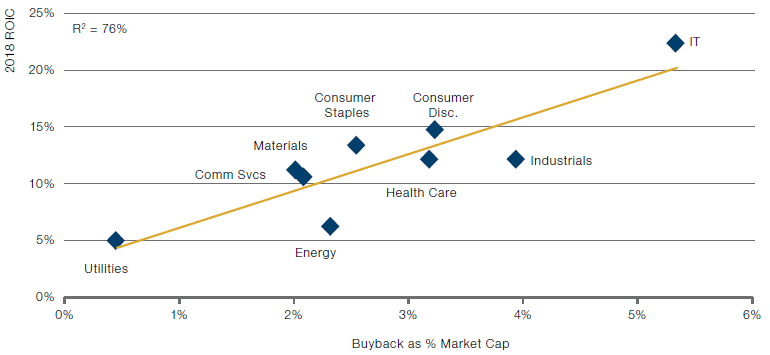
In addition to broad based measures, the proposals also raise the tax rate on global intangible low-taxed income (‘GILTI’) to 16.5%, increase the base erosion and anti-abuse tax (‘BEAT’) to 10% for the next two years (and 12.5% thereafter) and reduce the foreign derived intangible income (FDII) deduction. These measures seem specifically designed to tax those companies who have benefitted most from previous tax regimes: intangible-heavy sectors such as IT and healthcare, and those firms with substantial overseas operations (Figure 3). These firms are often some of the largest listed names and have frequently been the best performers in the stock market over the last ten years (Figures 4-5). In addition, two US Senators have proposed a 2% buyback tax, something which will again hit the tech sector the hardest (Figure 6).1
It is worth remembering that even the best-laid political plans rarely survive contact with reality intact: President Biden stood for election on a proposed corporate tax rate of 28%. While we would expect the bill to be further watered down as it goes through Congress, the overall messaging from Capitol Hill is clear. Corporations, and most of all the tech giants, are the ones who are on the hook for the infrastructure bill – if and when it arrives.
Figure 1. Corporate Profits After Tax/GDP

Source: Federal Reserve Bank of St Louis; as of April 2021.
Figure 2. Key Tax Provisions for the House Ways and Means Committee – Preliminary Figures

Source: House Ways and Means Committee; as of 21 September 2021.
Problems loading this infographic? - Please click here
Source: Man GLG; as of 21 September 2021.
Problems loading this infographic? - Please click here
Source: Man GLG; as of 21 September 2021.
Figure 5. Company Performance by Quintile – Intangibles as a Percentage of Total Assets

Source: Bloomberg, Man GLG; as of 21 September 2021.
Figure 6. US Sector ROIC and Buybacks as a Percentage of Market Cap

Source: Man GLG; as of 21 September 2021.
How Much is The Bill? Energy Price Rises in Context
After a startling rise in gas prices in energy costs in Europe, we thought it worth examining how a global energy price squeeze has affected the world’s largest economy.
Unsurprisingly, the amount Americans spend on energy has risen sharply in tandem with global prices moves. At USD1.5 trillion, we are now at all-time highs in absolute terms (Figure 7).
However, US energy expenditure is still quite small in compared to history, at just under 7% of GDP. This figure was much higher in the aftermath of the 1973 Oil Crisis, climbing to a high of around 13% in 1981 (Figure 8).
However, just because energy spending is a small percentage of GDP doesn’t mean that it won’t be felt by the consumer. The change in energy consumption as a percentage of GDP in 2021 is the fourth highest in our dataset and the second biggest one-year increase – beaten only by 1974, after OPEC’s oil embargo sent energy prices rocketing (Figure 9). While this moves us back towards the historical average, the sheer size of the jump is almost certain to take consumers and companies by surprise – and may filter through to corporate margins.
Problems loading this infographic? - Please click here
Source: EIA, Man GLG; as of 21 September 2021.
Problems loading this infographic? - Please click here
Source: EIA, Man GLG; as of 21 September 2021.
Problems loading this infographic? - Please click here
Source: EIA, Man GLG; as of 21 September 2021.
With contribution from: Ed Cole (Managing Director – Discretionary Investments, Man GLG)
1. Reuters, ‘U.S. Senate Democrats float stock buyback tax as part of $3.5 trillion bill’; 10 September 2021.
You are now leaving Man Group’s website
You are leaving Man Group’s website and entering a third-party website that is not controlled, maintained, or monitored by Man Group. Man Group is not responsible for the content or availability of the third-party website. By leaving Man Group’s website, you will be subject to the third-party website’s terms, policies and/or notices, including those related to privacy and security, as applicable.