A Warning From Our Valuation Indicator...
After a week in which the S&P 500 index sold off by 1.6% on Monday, and then rose 2.7% by the Friday close, stock valuations have come to the forefront of our minds. Just how expensive is the current equity market?
Our compositive valuation indicator tracks a combined Z-score of various metrics which compare bond and dividend yields to each other and to inflation. If this gives a reading above one, equities are expensive compared to bonds and vice versa.
Put simply, the year-long reflation trade we’ve experienced has left stocks looking extremely expensive compared to bonds. This trend is not just confined to the US; Europe is the most expensive it has been since the dotcom bubble and Japan is fractionally under its highest reading in our dataset. The only exception is EM, and even here the reading is at the highest end of the neutral range.
Figure 1. Compositive Valuation Indicators
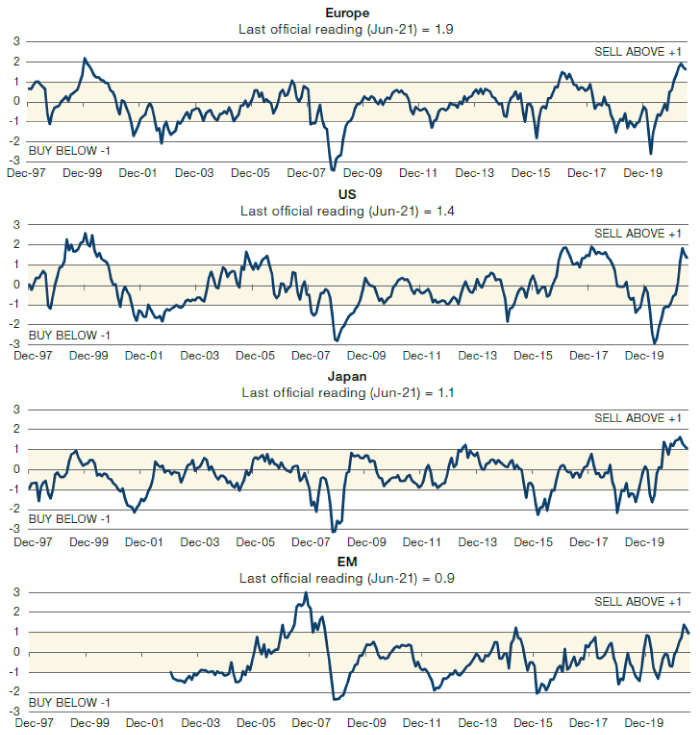
Source: Man Solutions, Bloomberg, MSCI; as of 30 June 2021.
…And No One Is Shorting
Perhaps unsurprisingly given how expensive stocks have become, shorting activity decreased over the course of Q2.
Our Utilisation factor – describing the amount of shares borrowed for use in short trades – fell from 4.8% to 4%, and 11.3% to 10.4% on a cap-weighted and equal-weighted basis respectively (Figure 2). It seems fair to say that the reflation has driven shorts from the market; this represents the lowest level of shorting activity since the start of our dataset in 2006.
However, while we have seen an overall decline in shorting, what activity there has been has seen a stronger inverse relationship with Value, Quality and Momentum over the course of the quarter (Figure 3).
Figure 2. Utilisation Time Series
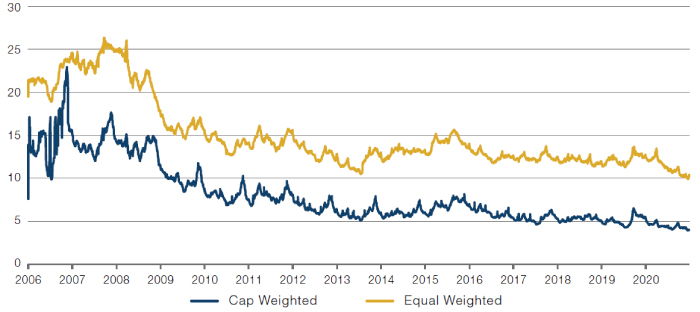
Source: Man Numeric; as of 30 June 2021.
Figure 3. Utilisation of Unattractive Minus Attractive by Alpha
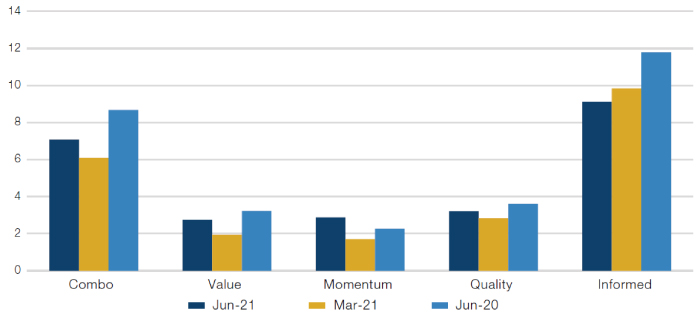
Source: Man Numeric; as of 30 June 2021.
With contributions from: Teun Draaisma (Portfolio Manager, Man Solutions) and Dan Taylor (Man Numeric, CIO).
You are now leaving Man Group’s website
You are leaving Man Group’s website and entering a third-party website that is not controlled, maintained, or monitored by Man Group. Man Group is not responsible for the content or availability of the third-party website. By leaving Man Group’s website, you will be subject to the third-party website’s terms, policies and/or notices, including those related to privacy and security, as applicable.