A More Efficient Carbon Price?
Emitting carbon into the atmosphere is the world’s greatest externality – an activity where, save for regulation, emitters bear no explicit cost for polluting but consequences are borne by the entire world in the form of climate change.
Carbon pricing is one way of imposing costs onto an externality. By charging companies an upfront price for the right to emit one tonne of CO2 or equivalent, firms are forced to realise the cost of the own pollution.
But a carbon price is only an effective deterrent if it bears some relationship to reality: if costs are too low, companies aren’t discouraged from polluting; if prices are too high, the carbon price becomes a burdensome tax on a global economy which is yet to truly move away from reliance on burning hydrocarbons for power. The lack of efficiency in carbon prices has therefore been a major concern of responsibly minded investors, with prices staying stubbornly low for many years, irrespective of changes to economic conditions.
However, there is cause for hope. Not only have carbon prices increased 72% in 2021, but they are becoming more and more correlated with oil prices (Figure 1). Indeed, by July 2021, the correlation had moved to around +0.95, indicating carbon prices were moving almost in lockstep with crude oil.
In our view, this is a positive step. Intuitively, carbon prices should reflect energy prices as well as being high enough to push the costs of pollution back onto emitters. Could this be a sign that the carbon market is becoming more efficient?
Figure 1. Carbon Emission Allowances Versus Rolling 12-Month Correlation Between WTI and Carbon Allowances
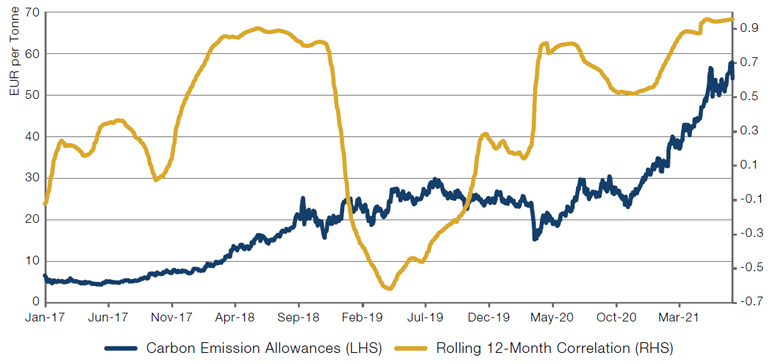
Source: Bloomberg, Man Numeric; as of 6 July 2021.
How Do Rates Affect Factors?
US inflation jumped to 5.4% year-on-year in June, beating analyst expectations of 4.9%. Given this jump, and the increasing noise regarding rate hikes, it is worth considering what happens to equity factors in different rate environments.
Figure 2 shows the rolling 36-month slope of equity factor returns compared to US 10-year Treasury returns. The constituent parts of Value – book-to-price and earnings yield – appear to be short US 10-year returns. So, if interest rates were to increase, the negative slope means that Value should do well as Treasury returns fall.
On the other hand, Momentum and Size appear to have the opposite relationship with US 10-year Treasury returns.
Figure 2. Rolling 36-Month Slope of Factor Return to US 10-Year Returns
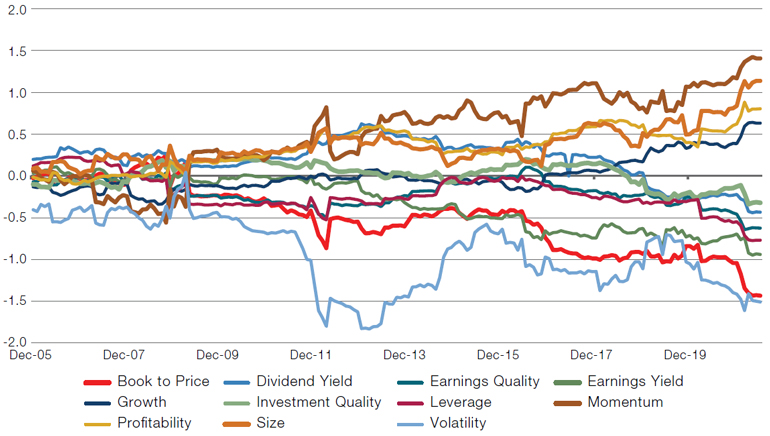
Source: Man Numeric; from 31 December 2005 to 30 June 2021.
With contributions from: Robert E. Furdak (Man Group, CIO – ESG) and Jayendran Rajamony (Man Numeric, Head of Alternatives).
You are now leaving Man Group’s website
You are leaving Man Group’s website and entering a third-party website that is not controlled, maintained, or monitored by Man Group. Man Group is not responsible for the content or availability of the third-party website. By leaving Man Group’s website, you will be subject to the third-party website’s terms, policies and/or notices, including those related to privacy and security, as applicable.