New Highs Beget New Highs
At the beginning of the month, the S&P 500 Index recorded seven consecutive sessions of all-time highs, a feat not seen since 1997.
But what happens when equity markets repeatedly make new all-time highs? Given the recent market jitters, should investors associate market highs with the irrational exuberance that goes before a selloff and the end of the cycle?
Our analysis, based on 113 instances of five consecutive all-time highs since 1927, shows that this is not the case. Indeed, following five consecutive all-time highs, the S&P 500 Index showed positive returns over a 1-month, 3-month, 6-month and 12-month period (Figure 1). The worst we can say is that returns over one and 12 months look a bit more fragile than in the unconditioned sample. But over three and six months, these clusters of new highs tend to suggest further strength, with a relatively high degree of confidence.
Figure 1. S&P 500 Forwards Returns After Five Consecutive New All-Time Highs
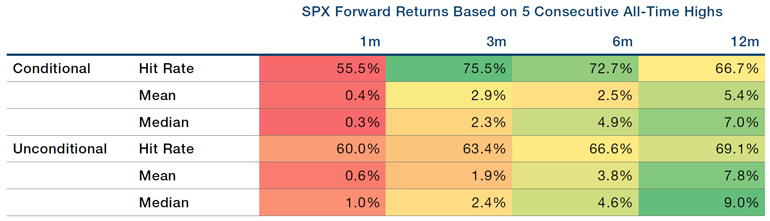
Source: Bloomberg, Man GLG; as of 6 July 2021.
The Customers Are Badly Trained…
One of our favourite scenes in the book Liar’s Poker is when senior Salomon Brothers executives launch a tirade against their European sales teams. When the sales teams protest that the European market is competitive and fragmented, and investors don’t wish to buy from Salomon, the reaction is priceless: according to Salomon Brothers management, the sales teams have failed to train their customers properly.
We thought of this story when we were looking at how different sectors have reacted to the supply constraints imposed by the coronavirus recovery. From chip and labour shortages to surging commodity costs, corporates should theoretically be in a tight spot when coming to passing costs onto their consumers.
However, this very much depends on the type of consumer the corporates sell to.
Take the auto sector, for example. Within the sector, original equipment manufacturers (‘OEMs’), who produce cars under their own brand and sell to the public, have been able to pass on the higher costs. In our view, this is not just driven by booming demand and consumers flush with savings, but also the fact that the end consumer is fragmented. However, those firms who make auto parts for sale to OEMs have not been able to pass on the higher costs because their end consumers are concentrated and can push back on any cost increases.
The same is true in the temporary staffing sector. A shortage of skills should, in theory, result in increased margins for the recruitment agencies as employers would be forced to offer higher wages to attract candidates, increasing the size of recruiters’ fees. However, large firms represent a bigger proportion of the customer base, and are better able to push back on increased prices.
In contrast, we’ve recently seen strong earnings statements from distributors and builders merchants, whose business model involves selling to a fragmented customer base.
Contra Salomon Brothers, it really isn’t about training the customers – it’s your customer base that ultimately trains you.
Figure 2. US Automotives – Inventories/Sales
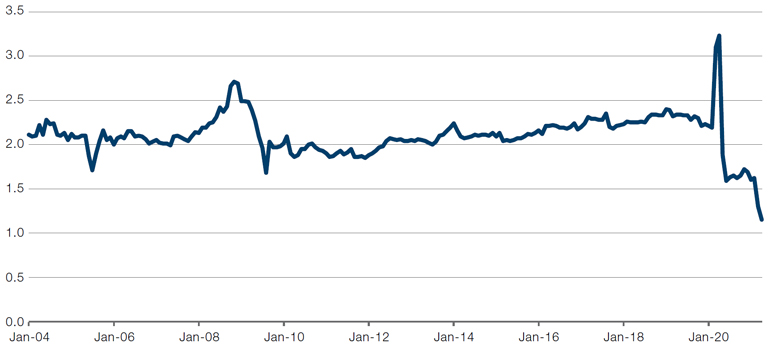
Source: Nordea; as of 20 April 2021.
Figure 3. US Temporary Employment Volume Growth – Two Years
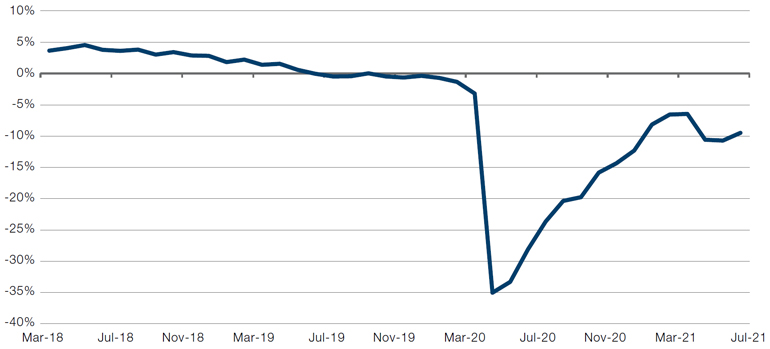
Source: Credit Suisse; as of 31 June 2021.
Ignore Supply and Demand? Commodities as Just Another Risky Asset
From lumber to steel, there has been a broad-based commodities boon this year, driven by both supply shortages as well as pent-up demand. The Bloomberg Commodities Spot Index, a measure of about 20 raw material prices, is up 18.6% since the start of the year and nearing its 2008-11 peak.
However, a word of caution: rather than just looking at supply and demand dynamics, we believe it is prudent to view commodities as a ‘risky’ asset, as commodities tend to decline when the rest of the market sells off. Indeed, Figure 4 shows the betas of the Bloomberg Commodity Index, as well as a selection of other commodities, to the MSCI World Index. All of them are positive, some markedly so, implying that a selloff in equity markets tend to result in a decline in commodities.
Perhaps even more importantly than having positive betas, tail risk also seems to be highly correlated. As illustrated in Figure 5, major commodities selloffs have occurred at exactly the same time as equity markets collapses – precisely what one doesn’t expect if an asset class is driven purely by the fundamentals of supply and demand in the real economy.
Figure 4. Commodity Betas to Equities
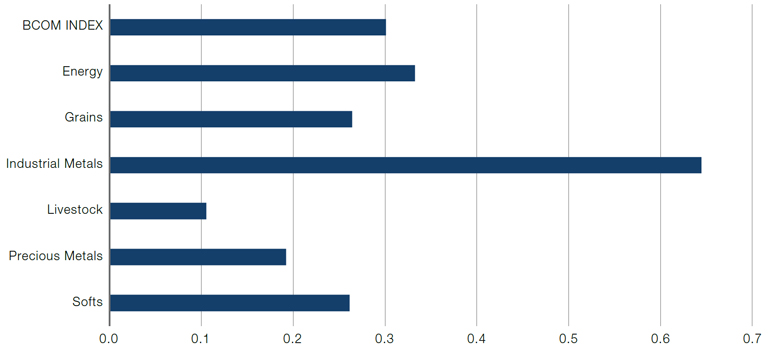
Source: Bloomberg, Man FRM; as of 26 June 2021.
Figure 5. Bloomberg Commodities Index Versus MSCI World
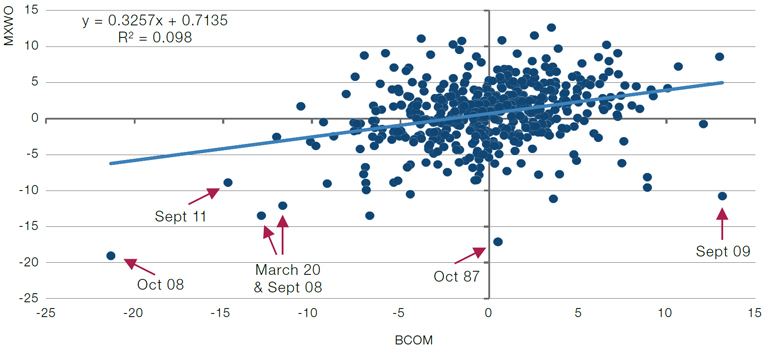
Source: Bloomberg, Man FRM; as of 26 June 2021.
With contributions from: Ed Cole (Man GLG, Managing Director – Discretionary Investments), Brentley Campbell (Man GLG, Portfolio Manager) and Jonathan Daffron (Man FRM, Deputy Head of Investment Risk).
You are now leaving Man Group’s website
You are leaving Man Group’s website and entering a third-party website that is not controlled, maintained, or monitored by Man Group. Man Group is not responsible for the content or availability of the third-party website. By leaving Man Group’s website, you will be subject to the third-party website’s terms, policies and/or notices, including those related to privacy and security, as applicable.