Lower Equity Volatility – Wishful Thinking?
A widespread view, especially among sell-side banks, is that the currently high equity volatility as depicted by the VIX is likely to return to more ‘normal’ lower levels (Figure 1).
Figure 2 shows the level of the VIX at the end of each quarter, compared with the return of the S&P 500 Index over the quarter. As a rule of thumb, as equity markets fall, volatility rises as companies become more levered. Conversely, as equity markets rise, volatility falls. However, there are notable exceptions to this rule – where both equity markets and volatility rise at the same time – depicted by the data points above the red curve.
The relative weighting of various sectors within the index explains some of these instances (Figures 3-4). Even after the communication services sector reshuffle in September 2018 – where the technology sector lost about 5% of its weight on the S&P 500, decreasing from more than 26% to about 21% – the sector has steadily increased its weighting in the index.
Sectors like technology are typically more volatile than others, such as consumer staples. When volatile sectors dominate the index, we get more instances of simultaneous increases in equity markets and volatility, notably during the tech bubble of the late 1990s. Indeed, we see a similar make-up of the S&P 500 today.
In our view, the only way equity volatility is likely to decline is if the tech sector has a gentle rebalancing. If, alternatively, things remain as they are with the sector concentration in the index and ‘normal’ volatility for tech and communication services stocks, then volatility is much more likely to stay elevated, with consequences for position sizing, portfolio construction and option pricing, amongst others.
Figure 1. VIX Is Still Elevated
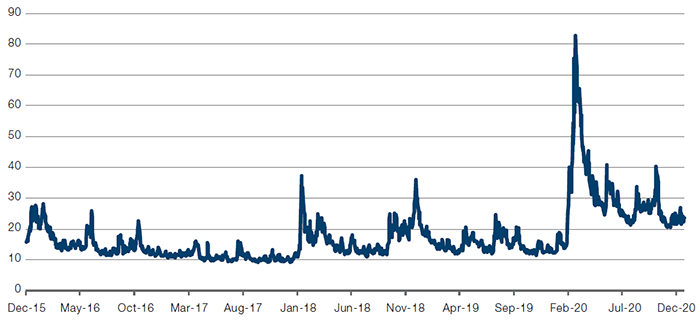
Source: Bloomberg; as of 15 January 2021.
Figure 2. VIX Level Versus S&P 500 Quarterly Returns Since 1990
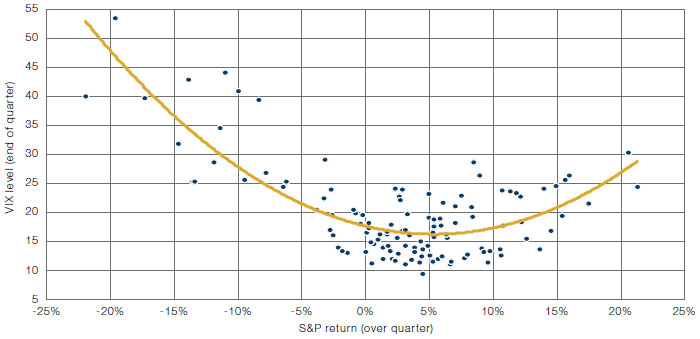
Source: Man Group; as of 31 December 2020.
Figure 3. S&P 500 Index Sector Composition Over Time – Five Highest Sector Weights
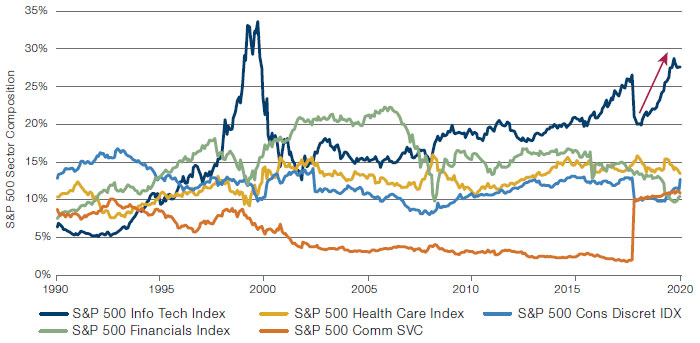
Source: Man Group; as of 31 December 2020.
Figure 4. S&P 500 Index Sector Composition Over Time – Six Lowest Sector Weights
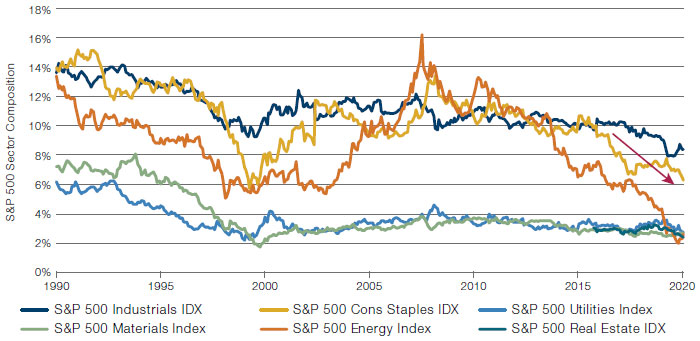
Source: Man Group; as of 31 December 2020.
The Value in Bond Vol?
In contrast to equity volatility, fixed income volatility (as measured by the MOVE index) remains close to the lows of the last 20 years, even as bond yields have started to rise.
While this may reflect confidence in the Federal Reserve’s desire and ability to control the yield curve, the passing of elections and expectations of fiscal stimulus have led to sharp moves higher in rates, inflation breakevens, commodity prices and even bitcoin.
With the Fed targeting inflation of more than 2%, there remains a chance that the market chooses to reprice bonds more rapidly than currently implied by volatility markets. As such, investors may find value in fixed income options – both as hedges and volatility trades.
Figure 5. Fixed Income Volatility at Lows
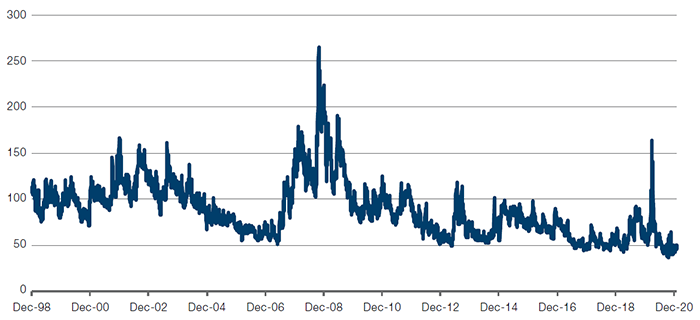
Source: Bloomberg; as of 14 January 2021.
With contribution from: Peter Van Dooijeweert (Man Solutions, Managing Director – Multi-Asset Solutions).
You are now leaving Man Group’s website
You are leaving Man Group’s website and entering a third-party website that is not controlled, maintained, or monitored by Man Group. Man Group is not responsible for the content or availability of the third-party website. By leaving Man Group’s website, you will be subject to the third-party website’s terms, policies and/or notices, including those related to privacy and security, as applicable.