Do Treasury Cash Levels Imply Quantitative Tightening?
At the time of writing, it’s all but certain that Congress is unlikely to raise the US debt ceiling before the Senate leaves for summer recess. The debt ceiling is the maximum amount the US government can borrow to meet its financial obligations. When the ceiling is reached, the Treasury cannot issue any more bills, bonds, or notes. It can only pay bills through tax revenues, or by dipping into its savings (i.e., the cash balance) at the Treasury.
At the end of July, the Treasury’s cash balance was only USD442 billion, a relatively low level. For context, between the end of June and end of July, the cash balance fell by USD398 billion.
In a ‘normal’ world (where the debt ceiling isn’t an issue), the US Treasury would not have tapped into its cash balance. Instead, it would have issued enough debt to match its spending needs. Net net, this would have no impact on markets – the amount the Treasury spends (which is like a cash injection into the US economy) would be offset by the amount of debt issuance (this would take liquidity out of the system as investors would be using their cash to buy US Treasury instruments).
However, in the last few months, the US Treasury has slowed down issuance because of the debt ceiling. This, in turn, has forced the Treasury to tap into their ‘rainy day’ fund and deplete its cash balance. Because it hasn’t done much issuance to take out liquidity, net net, these actions by the US Treasury have acted like substantial quantitative easing (i.e., cash injection without the offsetting liquidity withdrawal from issuance).
Separately, the Treasury has indicated that once the debt ceiling is increased, it plans to run the cash balance at USD750 billion. This would imply that the Treasury is taking more out of the system via issuance than it is putting back into the system via spending, because it is replenishing its rainy-day fund. This acts like quantitative tightening.
In addition, there is a roughly 6-week lag between changes in the Treasury cash account and the impact on longer-dated Treasury yields (Figure 1). As such, it is possible that Treasury yields may fall further or remain at the current low levels for another six weeks or so.
If private sector market participants still have any ability to anticipate future developments, then we are likely near the point where investors begin to reduce their rates positions to make room for the increased issuance that would take place the moment the debt ceiling rollover happens. In due time, this should have an impact asset prices that depend on long-term yields.
Figure 1. 10-Year Treasury Yield and US Treasury Cash Balance Held at the Fed
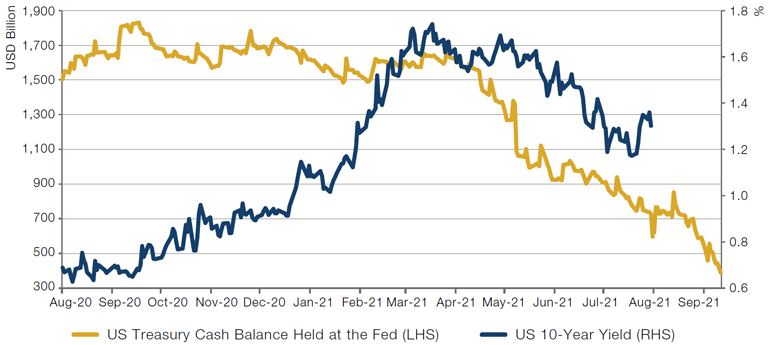
Source: Bloomberg; as of 10 August 2021.
Note: US Treasury cash balance held at the Fed leading by 45 days.
Default Position: Why Credit Looks Pricey
One way to look at credit valuation is by calculating an implied default rate, based on where an instrument’s yield is trading relative to an equivalent maturity government security, or ‘spread’ in industry parlance. In Figure 2, we show different parts of the credit universe segmented by currency and rating and, for each segment, what the current spread is in basis points.
The fourth and fifth columns in Figure 2 take this spread and decompose it into that which is compensating for defaults – in other words, the risk that the company might go bankrupt and that which is compensating for downgrades (where the company remains solvent, but its credits are viewed less favourably by ratings agencies, with consequent adverse price implications). The method for making this split is complicated and beyond the scope of this short article.1
In columns 6-7, we convert the portion of the spread that compensates for default risk into an implied default rate based on assumed recovery rates (‘RR’) of 20% and 40%. Historically, investors in developed market credits that went bankrupt have managed to recoup around 40% of their investment, and this is therefore the column we focus on. We compare the numbers here to those which have been realised on average, and in the worst-case scenarios, for each of these segments (the final two columns). If the default rate implied by the spread is below that which has been realised on average through history, then we can infer that one is not being properly compensated for taking on the credit risk and the space is expensive. We thus colour the cell red to reflect this. If the implied rate is greater than the historic worst-case scenario, then the opposite is true, and the cell turns green (with a spectrum running between the two colours).
So, what do we see today? In our view, there is not much opportunity from a valuation perspective. US dollar investment grade credits are implying 5-year cumulative default rates of 0.6%, compared with 1.0% experienced on average over the past century. And the same is true further down the rating spectrum: US dollar high yield paper is implying a 10.4% default rate, versus 16.7%.
In summary, we can say that credit prices today are suggesting the default environment is only about 60% of its normal level. Perhaps this is justified by non-valuation factors – highly accommodative central banks and governments unwilling to allow much creative destruction, for instance. But investors should be under no illusions about getting a cheap deal.
Figure 2. Credit Spreads – Implied Default Rates and Historic Realised Defaults
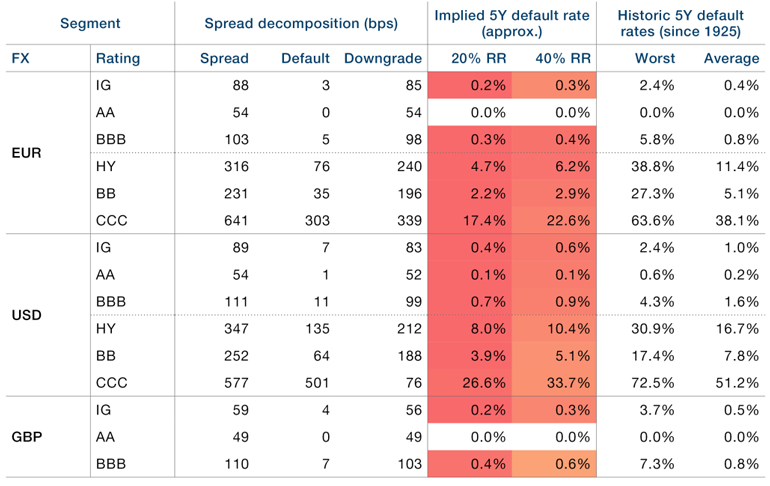
Source: Bloomberg, Man Solutions; as of 31 July.
With contribution from: Guillermo Osses (Man GLG, Head of Emerging-Market Debt Strategies, Man GLG) and Henry Neville (Analyst, Man Solutions).
1. For those interested in the methodology, please get in touch with your relationship manager.
You are now leaving Man Group’s website
You are leaving Man Group’s website and entering a third-party website that is not controlled, maintained, or monitored by Man Group. Man Group is not responsible for the content or availability of the third-party website. By leaving Man Group’s website, you will be subject to the third-party website’s terms, policies and/or notices, including those related to privacy and security, as applicable.