Inflation and the Base Effect
Last week, the US March year-on-year CPI reading came in at 2.6%. As the base effects from the lockdown-impacted 2020 readings start coming into the denominator from here, what can we expect for the next two months?
Over the last cycle, 2009-19, month-on-month inflation averaged 0.3% for both April and May. If we apply this to March value of the CPI basket, we get implied year-on-year prints of 3.7% and 4.1%, respectively.
And that’s just the base effect. If we get some feed through from a number of supply bottleneck metrics we watch that are currently flashing red – for instance, the ISM Supplier Deliveries index at 77, the highest reading since the 1970s; and the NFIB Planning Higher Prices index at 34, its highest reading since 2008 – we may get readings that are even higher.
Everyone talks about the base effect, so in theory it should be priced in. But a US CPI reading north of 4% has not been seen since before the Global Financial Crisis, and it will be interesting to see whether the market can take it in its stride… Or not.
Figure 1. ISM Supplier Deliveries Index
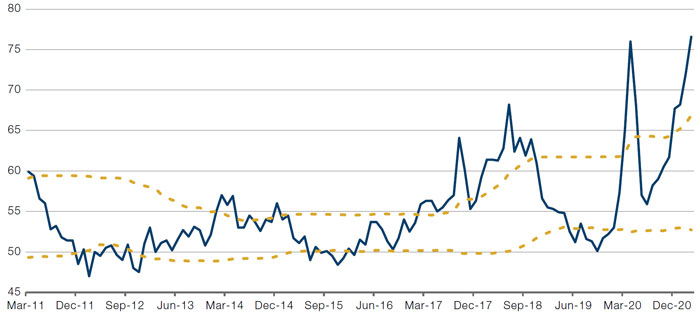
Source: Bloomberg, Man Solutions; as of 8 April 2021. Note: Yellow dashed lines are moving averages +/- 1 standard deviation on a 3-year lookback.
Figure 2. NFIB Planning Higher Prices Index
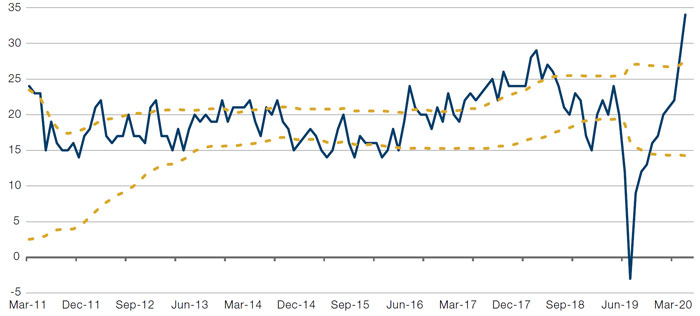
Source: Bloomberg, Man Solutions; as of 8 April 2021. Note: Yellow dashed lines are moving averages +/- 1 standard deviation on a 3-year lookback.
CVIs and the Vulnerability of Equities
It’s worth noting that these potentially high inflation numbers will be coming on top of pretty full equity valuations, especially in Europe.
Our Compositive Valuation Indicators (‘CVIs’) – which compare yields available on equities across a variety of metrics such as cash flow, earnings and dividends against government bonds, cash rates and inflation – have steepened sharply across all four geographies since late 2020 (Figure 3). Indeed, in Europe, the CVI has breached the +2 level for the first time since the dotcom bubble.
The biggest driver has been the decline in the cash earnings yield from 9.5% to 8.8% as government yields across the continent doubled – for instance, the 10-year bund yield has risen from around -60 basis points to -30bp. Part of the reason for such outsized moves in relative valuation from such small moves in the absolute level of yields is convexity; a 30bp move has a much greater effect on valuation when yields are low.
This further highlights the vulnerability of equities on a relative basis – if inflation does rise, and government bond yields with it, then there could be a significant negative headwind for equities. Bonds don’t have to cheapen by much to leave equities high and dry.
Figure 3. Compositive Valuation Indicators
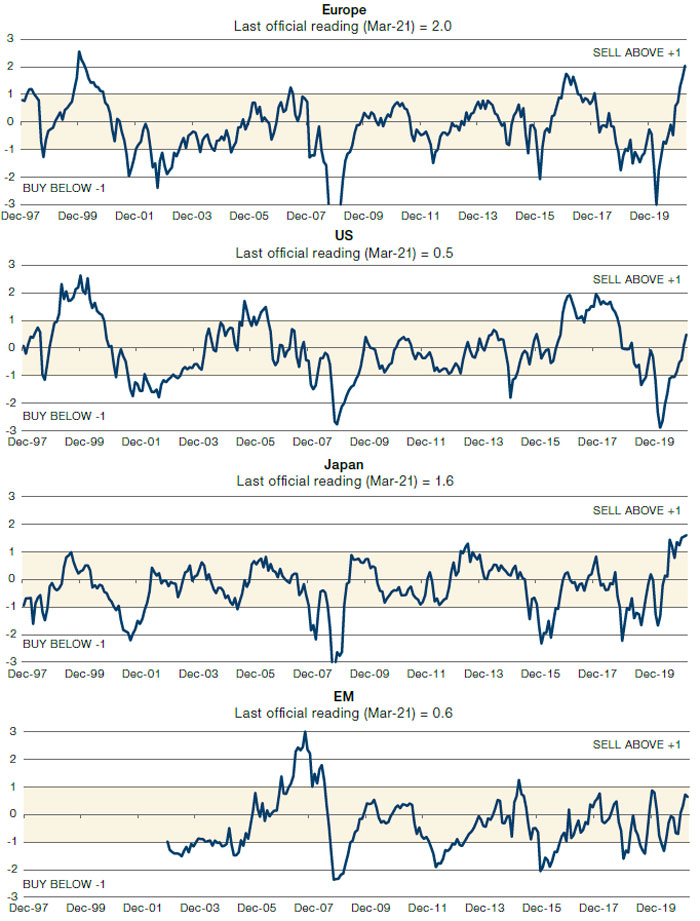
Source: Bloomberg, MSCI, Man Solutions; as of 8 April 2021. Each CVI is a combined Z score of the following 7 ratios: BY/DY, BY/BVY, BY/EY, 3M rate / EY, CPI / DY, CPI / EY and CPI / CEY. For Europe and Japan we subtract one from the other, rather than use a ratio, given negative rates. The model buys when equity yields are high relative to bond yields, inflation and cash rates.
With contribution from: Henry Neville (Man Solutions, Analyst).
You are now leaving Man Group’s website
You are leaving Man Group’s website and entering a third-party website that is not controlled, maintained, or monitored by Man Group. Man Group is not responsible for the content or availability of the third-party website. By leaving Man Group’s website, you will be subject to the third-party website’s terms, policies and/or notices, including those related to privacy and security, as applicable.