Quote of the Week:
"It is the UK a lot more than us that needs an agreement."
Cherry Blossom and Wallflowers: Japan’s Cycle in the Shadows
Imagine a stock that had consistently achieved margin expansion and earnings-per-share growth, but had got cheaper. For a stock-picker, this scenario is what dreams are made of.
As it turns out, this scenario is reality, but on a regional basis rather than describing a single stock. We looked at four components – margin expansion, multiple expansion, other earnings-per-share growth and cash returns to shareholders – to determine total return across four regions over the last cycle: the US, Japan, Europe ex UK and emerging markets. The results are depicted in Figure 1.
Our analysis showed the US experienced growth in all the four components of return. Emerging markets have been a mixed bag: margin contraction, but at least the multiple got cheaper. Europe looks particularly unappetising, with stocks becoming more expensive via multiple expansion, while experiencing a contraction in margins and other EPS growth – although dividends improved over the period.
The standout contrarian opportunity is Japan, which has seen, in annualised terms, a margin expansion of 1.1%, other EPS growth of 0.8% and cash returns to shareholders of 1.9%, while multiples have fallen by 1.4%.In other words, Japan became cheaper over the period, despite improving operationally.
Figure 1. Annualised Return Decompositions
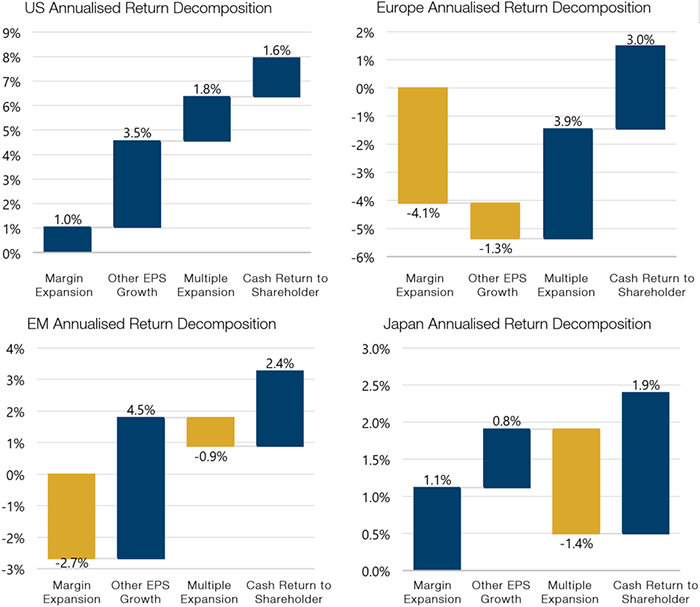
Source: Man Group; between Q3 2007 and Q4 2019.
A Faltering Rebound?
The OECD’s leading economic indicator (‘LEI’) has seen one of the fastest recoveries over the past few months, as the global economy bounces back from the coronavirus recession. However, the pace of that recovery is stalling.
Why does this matter?
Well, the 3-month change in the LEI (illustrated by the blue bars in Figure 2) is a reliable lead indicator for the 12-month change (illustrated by the orange line) i.e. the momentum of the blue bars is a good indicator of what is going to be happening in about 6 months’ time. Indeed, the momentum of the LEI is decelerating in all regions except the euro area, suggesting that we may well see a slowdown in the first quarter of 2021.
This potential air-pocket would force a shift in the narrative we have seen over the summer – which in general terms has been good for beta and cyclical assets after the nadir in the spring of 2020. Indeed, both may well look unappealing in risk-reward terms if the leading indicator proves accurate.
Figure 2. OECD Total Leading Economic Indicator
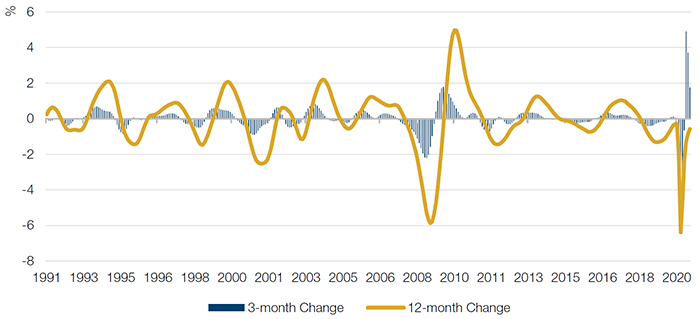
Source: OECD, Bloomberg; as of 30 September 2020.
With contribution from: Ed Cole (Man GLG, Managing Director – Equities).
You are now leaving Man Group’s website
You are leaving Man Group’s website and entering a third-party website that is not controlled, maintained, or monitored by Man Group. Man Group is not responsible for the content or availability of the third-party website. By leaving Man Group’s website, you will be subject to the third-party website’s terms, policies and/or notices, including those related to privacy and security, as applicable.