Quote of the Week:
"I WON THIS ELECTION, BY A LOT!"
Do South Korean Exports Suggest the Easy Recovery Is Over?
South Korea’s total exports slowed significantly in October. Exports dropped 3.6% year-on-year in October, compared with a year-on-year increase of 7.6% in September (Figure 1).
This metric is important because South Korea is an important bellwether for the global economy. A highly open, export-driven economy, South Korea’s two biggest markets are the US and China, making the country exceptionally sensitive to global trade flows. Additionally, the South Korean export data is very timely, with companies required – and incentivised – to report export values to South Korean Customs in a time-efficient manner.
As such, the recent South Korean export data may well mean that the overall pace of the global recovery is likely to slow down. Additionally, it also seems likely that any further recovery over the winter will be a slow grind especially as we factor in the effect of further lockdowns.
Figure 1. South Korean Total Exports
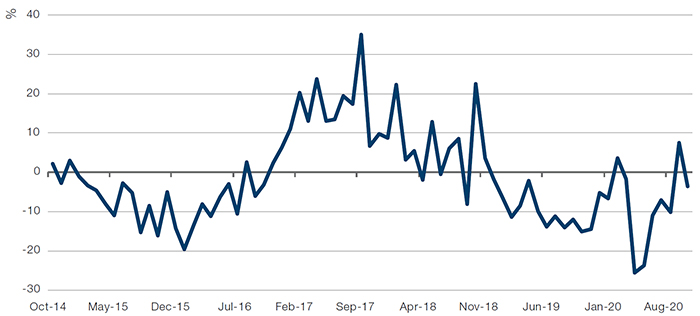
Source: Bloomberg; as of 31 October 2020.
Less Disinflation Than Normal
“It’s important to try to estimate the unemployment rate that is equivalent to maximum employment because persistently operating below it pushes inflation higher, which brings me to our price stability mandate.”
That is a quote from Janet Yellen on 18 January, 2017, where she was talking about the non-accelerating inflation rate of unemployment, or NAIRU. Simply put, it’s a measure of how low the unemployment rate can go before we start to see inflation rising by accounting for factors such as the demographics and technological advancement within a country.
Subtracting U3, or the headline rate of unemployment, from the NAIRU gives you a measure of the labour-market lag. Essentially, if this figure is above 0, it means that there are too many people working in the US economy. That NAIRU-U3 figure is currently at -4% (Figure 2), implying that we are four percentage points from that ‘o’ threshold. While this may seem deflationary, we would point out that we are experiencing a V-shaped recovery in US unemployment and the direction of travel of the ‘NAIRU-U3’ figure is inflationary.
Another inflationary signal comes from the CRB Rind Index, which is up 7% year-on-year1. Made up of a range of raw materials – from tallow and copper scrap to wool tops and rubber – the index is non-speculative, tracking the spot price of heavily used but infrequently talked about commodities. Without the speculative element, and given the importance of these commodities to the global economy, the index can be seen as an indicator of activity and real supply and demand.
Furthermore, the lowest year-on-year inflation figure in the US during the coronacrisis was 0.4%, in May 2020. The last two recessionary events – the Great Financial Crisis of 2008 and the recession in industrial production in 2015 – saw inflation trough at -2% and 0%, respectively. This is much less inflation that one might expect from an economic contraction as large as the coronacrisis – which was much bigger in terms of lost GDP than either one of our examples, and means that any future inflation pick-up will start from a much higher base than before.
On the other hand, one possible deflationary signal is the US election, which has, in all likelihood, produced a split government: with a Democrat majority in the House of Representatives, a Republican-controlled Senate and, at the time of writing, a likely Biden presidency. This raises the prospect of a diminished fiscal stimulus, without which it is difficult to envisage inflation breaking out – in our view, we would need a combination of fiscal and monetary stimulus to produce anything approaching real inflation.
In our view, that leaves us at an interesting crossroads. While the two signals we are looking at currently are pointing to inflation, a breakout could be delayed significantly in the absence of fiscal stimulus. Nevertheless, we have avoided outright deflation – which is rather remarkable. If May 2020 was indeed the inflation trough, and we do see fiscal stimulus, conditions for an inflation breakout are much better than could have been expected. Historically, equities perform best with stable inflation of around 1-2% - and with markets looking past political volatility now the US presidential election is in the rear-view mirror, we could be on course to reach this threshold.
Figure 2. US NAIRU – U3
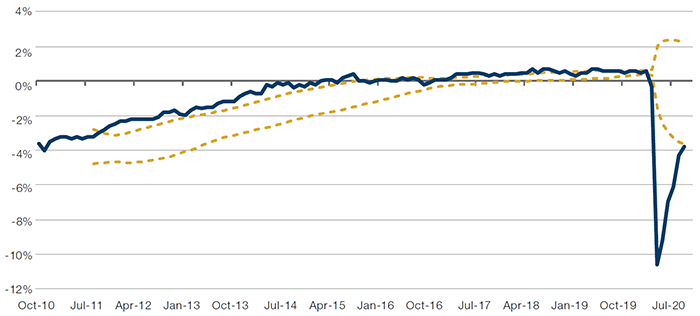
Source: Bloomberg, Man Solutions; as of 6 November 2020. Yellow dashed lines are moving averages +/- 1 standard deviation on a 3-year lookback.
Figure 3. CRB Rind Index, YoY Percentage Change
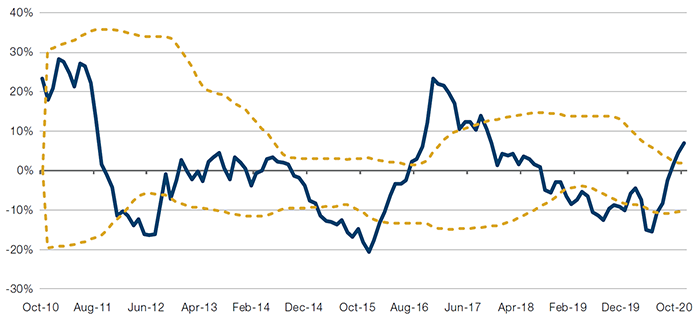
Source: Bloomberg; as of 6 November 2020. Yellow dashed lines are moving averages +/- 1 standard deviation on a 3-year lookback.
Is the Glass Half Full?
In the wake of the US election, it might seem that we had a cocktail of outcomes guaranteed to produce volatility:
- A long delay before all the ballots were counted;
- The sitting President initiating court proceedings to dispute the final result;
- The prospect of divided government, with a Democrat-controlled House of Representatives, a Republican Senate and a Democratic President; and
- A likely winner whose plans for tax reform would impose a significant hit on US corporate earnings.
However, we’ve actually seen the reverse (Figure 4). Equities have outperformed strongly, with the S&P 500 Index rising more than 7% between 2 November and 6 November. Over the same period, the VIX Index fell 13.2 points, while the US 10-year yields fell 6 basis points. All these indicate that markets received the results with equanimity.
In our view, investors have seen divided government as a brake on the Joe Biden campaign’s proposed tax hikes (which would be positive for US equities) and a likely restraint on higher government spending, killing any anticipation of a reflation trade (positive for US Treasuries).
Whether or not markets prove to be correct, it is undeniable that for the last week at least, investors have decided that the glass is half-full.
Figure 4. S&P 500 Index Versus VIX Index
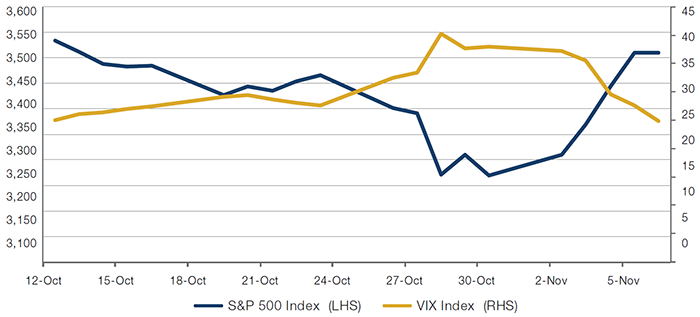
Source: Bloomberg; as of 6 November 2020.
With contribution from: Ed Cole (Managing Director – Equities, Man GLG), Ziang Fang (Senior Portfolio Analyst, Man Numeric), Henry Neville (Analyst, Man Solutions) and Otto van Hemert (Director of Core Strategies, Man AHL).
1. As of 6 November, 2020.
You are now leaving Man Group’s website
You are leaving Man Group’s website and entering a third-party website that is not controlled, maintained, or monitored by Man Group. Man Group is not responsible for the content or availability of the third-party website. By leaving Man Group’s website, you will be subject to the third-party website’s terms, policies and/or notices, including those related to privacy and security, as applicable.