Quote of the Week:
"We’ve got to be humbled in the face of nature. In this country [the UK] as in much of Europe, the virus is growing much faster than the reasonable worst-case scenario of our scientific advisers."
An Ominous Threshold
The percentage of stocks beating the S&P 500 Index over the trailing 12 months has fallen to around 30% (Figure 1).
Historically, crossing this threshold hasn’t been a positive indicator for stocks. The only other two times that less than 30% of stocks were beating the index were soon followed by large equity corrections: before the Oil Crisis of 1973 and the bursting of the tech bubble in 2000. In addition, we can see further declines in the ratio before equity sell-offs in 1982, 1990 and 2007, even though these did not approach the 30% threshold.
Figure 1. Percentage of Stocks Beating the S&P 500 (12 Months Trailing)
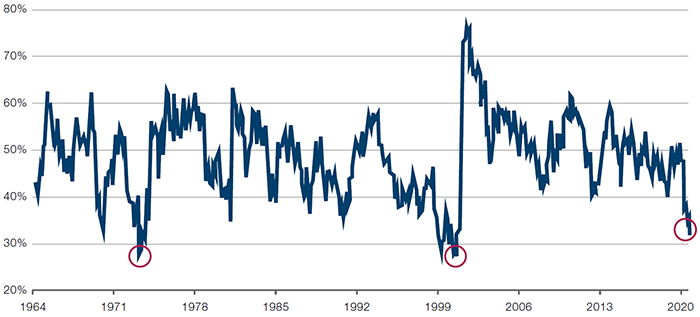
Source: Kailash Capital; as of 30 September 2020.
Go Mega or Go Home?
What if we told you that mega-cap tech is one of only a few sectors that’s actually justified in its valuation?
Figure 2 shows a historical comparison of the 10 biggest stocks in the Russell 1000 Index, on a market-cap and forward price-to-earnings (‘PE’) ratio basis, in 2000 and 2020. Note that with a few exceptions aside, the forward PE multiples of these biggest 10 stocks in 2020 have PE ratios that are consistently lower than in 2000. This is also against a much more favourable backdrop than in 2000, with US interest rates now at 0.25%.
Figure 2. Russell 1000 – Biggest 10 Stocks by Market Cap and Their PE Ratios
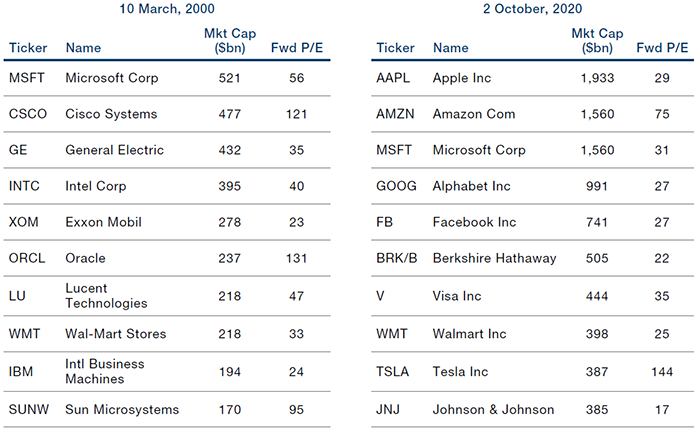
Source: Bloomberg; as of 2 October 2020. The organisations and/or financial instruments mentioned are for reference purposes only. The content of this material should not be construed as a recommendation for their purchase or sale.
By contrast, it is much easier to argue for a bubble outside of this list. Figure 3 shows the number of stocks in the Russell 1000, which trade with an enterprise value-to-sales (‘EV/sales’) ratio of more than 20x. Whilst not at the same level at the tech bubble of the late 1990s, the number has risen sharply. This is even more pronounced for the MSCI World, which is now approaching the same scale as 1999, and with almost all the companies based in the US (Figure 4).
Figure 3. Russell 1000, Number of Stocks with Over 20x EV/Sales
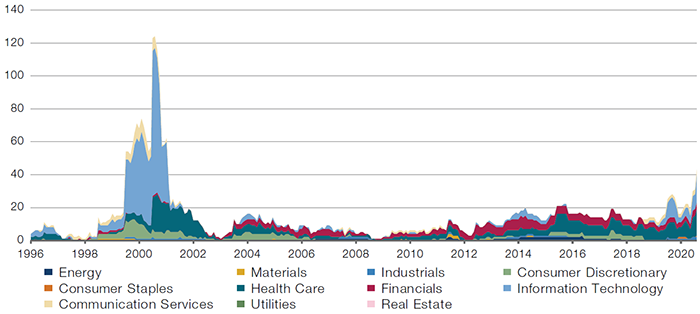
Source: Man Numeric, Bloomberg; as of 30 September 2020.
Figure 4. MSCI World, Number of Stocks with Over 20x EV/Sales
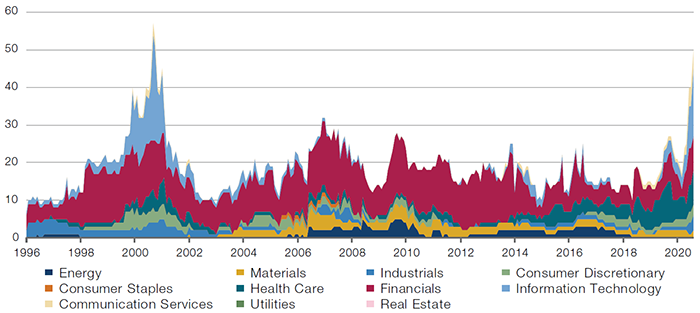
Source: Man Numeric, Bloomberg; as of 30 September 2020.
With contribution from: Dan Taylor (Man Numeric, CIO).
You are now leaving Man Group’s website
You are leaving Man Group’s website and entering a third-party website that is not controlled, maintained, or monitored by Man Group. Man Group is not responsible for the content or availability of the third-party website. By leaving Man Group’s website, you will be subject to the third-party website’s terms, policies and/or notices, including those related to privacy and security, as applicable.