Quote of the Week:
"Successive UK governments have “welcomed the oligarchs and their money with open arms, providing them with a means of recycling illicit finance through the London ‘laundromat’, and connections at the highest levels with access to UK companies and political figures.
Transition Impossible?
The spectre of ‘peak oil demand’ – the point when the world’s demand for the most prevalent fossil fuel begins to fall for good – has slowly morphed from far-fetched to long-term possibility to near-term certainty. The International Renewable Energy Agency (‘IRENA’) predicts that peak oil and the transition to more sustainable energy sources is likely to happen by 2030, much sooner than many investors anticipate. The electrification of the economy is highly unlikely to be limited to electric vehicles in transportation. Instead everything that requires large amounts of energy – from buildings to manufacturing – is likely to shift.
Figure 1. Renewable Electricity: The World’s Largest Energy Carrier by 2050
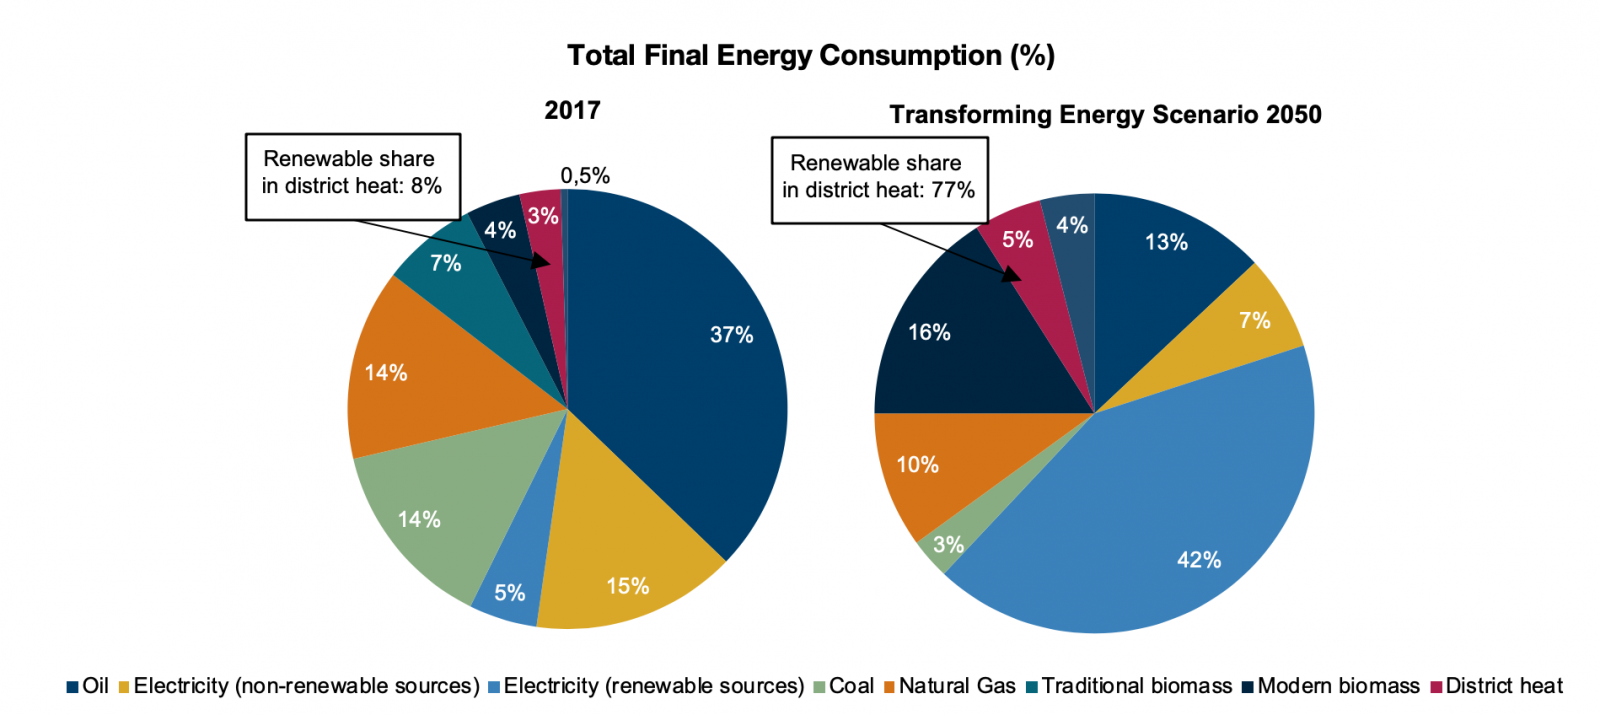
Source: IRENA, Global Renewables Outlook: Energy transformation 2050.
Much like other fundamental transitions we have seen in our lifetime – landlines to mobiles, print to digital – the sustainable energy transition is likely to be fuelled by an influx of investor capital to those embracing change or those developing new technologies. IRENA estimates around USD49 trillion will be spent between 2019 and 2030 to achieve this energy transition – more than double the size of the current energy market.
Already, we can observe the winners and losers of these transition markets. In the European utilities sector, we can see a marked difference in recent stock performance between those which have embraced the energy transition and those that continue to rely on higher carbon sources. The same holds true in the European oil & gas sector with a clear first-mover advantage to the companies which have flexibly adapted their business model towards biofuels and renewable energy.
Figure 2. European Utilities – Having a Green Party
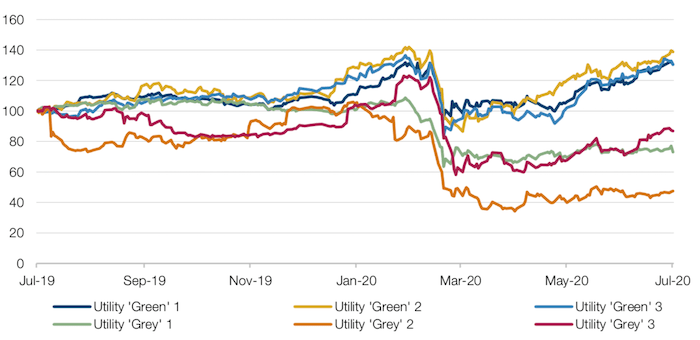
Source: Bloomberg; as of 22 July 2020.
Figure 3. European Oil & Gas – Pioneers and Laggards
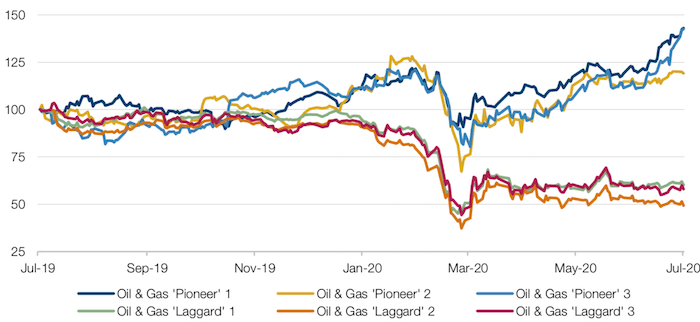
Source: Bloomberg; as of 22 July 2020.
While this trend has been boosted by EU commitments to cut carbon emissions to zero by 2050, it continues to hold true elsewhere. In the US, green utilities have similarly outperformed their more carbon intensive counterparts despite little enthusiasm from political powers. When comparing the two, it’s clear that despite a long history of European utility sector underperformance, this has been reversed as the energy transition gets underway.
Figure 4. European Versus US Utilities (10Y)
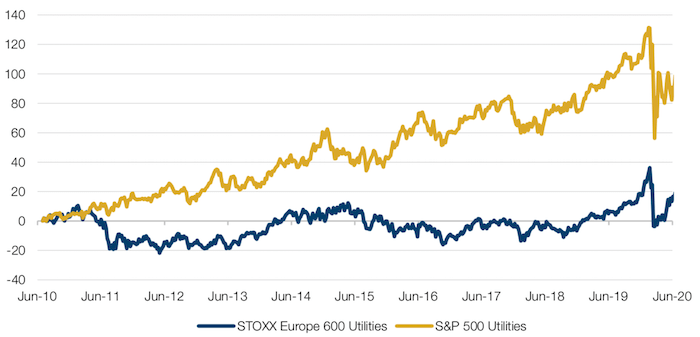
Source: Bloomberg; as of 22 July 2020.
Figure 5. European Versus US Utilities (1Y)
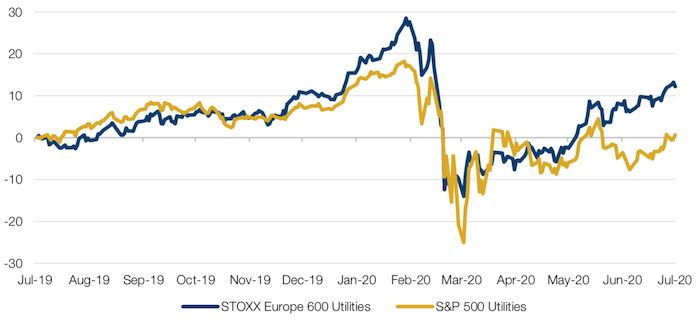
Source: Bloomberg; as of 22 July 2020.
The energy transition will only gain momentum over the next decade, in our view, as investors and companies alike discover the long-term return opportunities on offer. Tackling the climate crisis will require a wide range of solutions, not least establishing a cost on pollution through effective carbon pricing, but the shift from fossil fuels to renewable energy is here to stay.
The Carbon Efficiency Premium
As a counter point to a changing energy mix, it is worth highlighting another aspect of energy as it relates to equities: the carbon efficiency premium.
Figure 6 shows the European cumulative sector relative return of a long-short carbon intensity portfolio, constructed by selecting the best and worst performers on a sectoral basis for carbon intensity, as measured by Trucost data (going long the former and shorting the latter and thus producing a sector neutral portfolio).
The data implies that a premium exists for carbon efficiency, in that energy efficient stocks show higher cumulative returns than energy intense stocks. This is most pronounced during periods where energy costs (as measured by the price of crude oil) were high, such as between 2011-2014 and again in 2018. Nevertheless, the historical outperformance is such that the premium still exists in periods of low energy prices (such as 2019 and 2020). A further point of interest is that the amount the premium declines when energy prices fall has diminished: despite 2019 and 2020 seeing a rapid decline in oil prices, the premium has fallen by a smaller amount than earlier in the decade. In our view, this shows that investment managers are paying more attention to the carbon premium, regardless of oil prices.
Furthermore, the premium is not confined to Europe. Indeed, Figure 7 shows that the premium exists globally, with Japan the biggest and the US the lowest.
Figure 6. Cumulative Return of a Carbon Efficiency Long/Short Portfolio - Europe
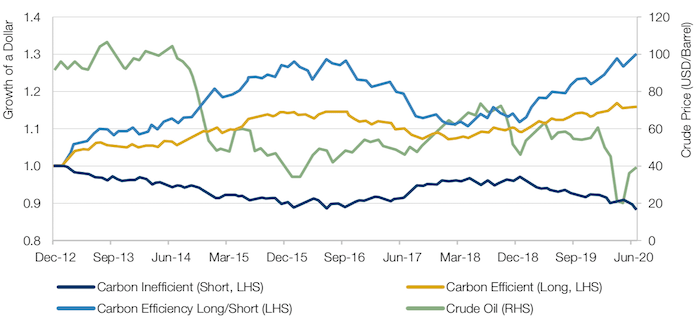
Source: Man Numeric; as of 21 July 2020. For illustrative purposes only.
Figure 7. Performance of Carbon Efficiency by Region
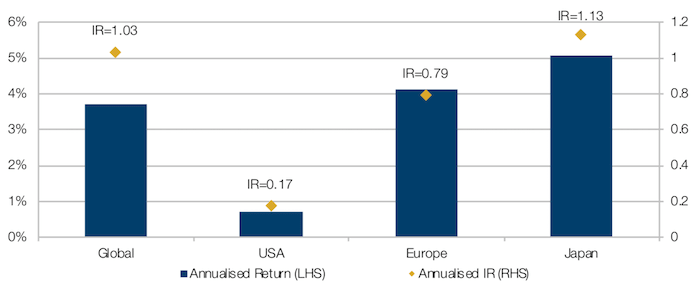
Source: Man Numeric; as of 21 July 2020. For illustrative purposes only.
Don’t Believe the Hype: Gold and Scepticism
On 23 July, gold broke above USD1,900 an ounce (Figure 8). As a traditional safe- haven trade, the gold price is often a rough barometer of investor confidence – with a steep rise indicating that investors don’t feel confident in the value of financial assets. In this case, we believe that the biggest driver of the gold price is a belief that the stock market bounce fails to reflect economic fundamentals.
But another contribution to gold’s recent gains is the poor returns offered by other safe haven assets. US 10-year Treasuries have strengthened slightly, with nominal yields falling back under 60 basis points. However, real yields have fallen to -0.91 bp (Figure 9), as break-even inflation has ticked up, providing a much poorer risk-reward outlook than would previously be the case.
In these conditions, gold may function better in a portfolio than other safe havens, acting as a hedge against both rising inflation and a potential stock market collapse.
Figure 8. Gold spot (USD per Troy Ounce)
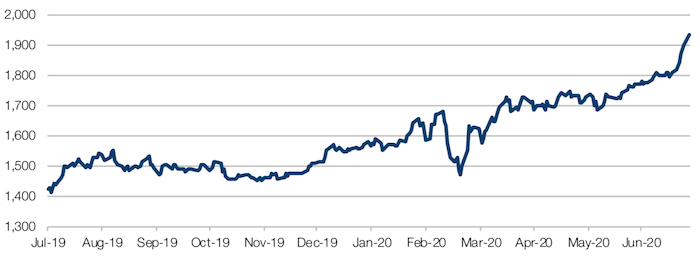
Source: Bloomberg; as of 27 July 2020.
Figure 9. US 10-year Treasury Yield – Nominal versus Real
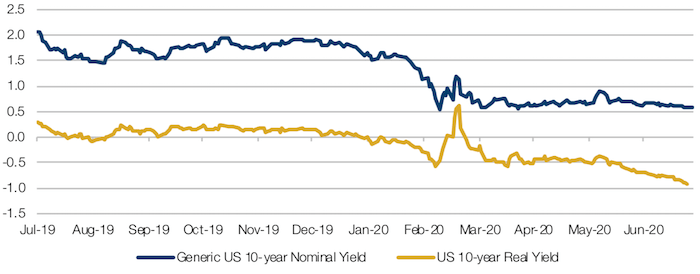
Source: Bloomberg; as of 27 July 2020.
A Bad Outlook for Momentum?
Rolling 6-month inter-decile spreads for global large-cap Momentum stocks have returned more than 20% through to 10 July, the highest since the Global Financial Crisis (Figure 10).
Going forward, however, the picture is less rosy, in our view. There is an appreciable negative correlation between Momentum returns in the previous six months and the factor’s performance over the next six months (Figure 11).
Figure 10. Long/Short Inter-Decile 6-Month Rolling Returns, Global Developed Market Momentum
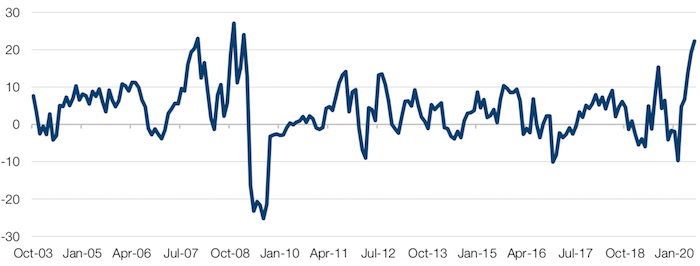
Source: Man Numeric; as of 10 July 2020. For illustrative purposes only.
Top decile versus bottom decile across Man Numeric’s Global Developed Large/Mid Cap universe (of about 3,500 stocks).
Figure 11. Correlation of Momentum Returns (Previous Six Months Versus Next Six Months)
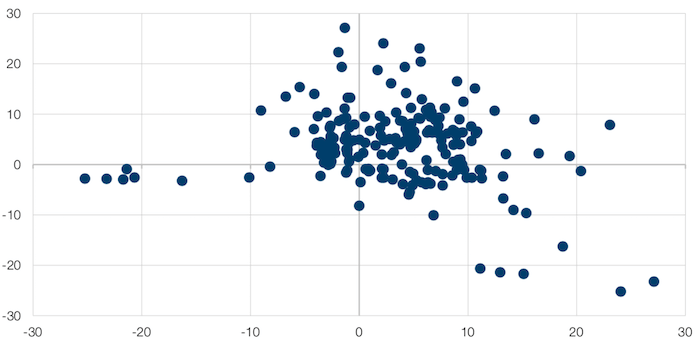
Source: Man Numeric; as of 10 July 2020. For illustrative purposes only. Top decile versus bottom decile across Man Numeric’s Global Developed Large/Mid Cap universe (of about 3,500 stocks).
With contribution from: Firmino Morgado (Man GLG, Portfolio Manager), Rob Furdak (Man Group, CIO for ESG), Matthew Sargaison (CIO and co-CEO, Man AHL) and Dan Taylor (Man Numeric, CIO).
You are now leaving Man Group’s website
You are leaving Man Group’s website and entering a third-party website that is not controlled, maintained, or monitored by Man Group. Man Group is not responsible for the content or availability of the third-party website. By leaving Man Group’s website, you will be subject to the third-party website’s terms, policies and/or notices, including those related to privacy and security, as applicable.