The Coronavirus in Context
On 7 January, Chinese authorities identified a new coronavirus causing cases of pneumonia in Wuhan City in the Hubei Province of China. The virus (named 2019-nCoV) comes from the same family of viruses that includes SARS and MERS, and is believed to have originated in a large animal and seafood market in Wuhan. Since the start of the outbreak, at least 361 people in China have died from the virus1, with more than 17,000 cases nationally. There have been 150 cases in about 24 countries excluding China, with one death in the Philippines (Figure 1).
Figure 1. The Wuhan Coronavirus
| Cases | Deaths | ||
|---|---|---|---|
| 17,384 Total cases | Mainland China | 17,205 | 361 |
| Hong Kong | 15 | 0 | |
| Macao | 8 | 0 | |
| Australia | 12 | 0 | |
| Cambodia | 1 | 0 | |
| Canada | 4 | 0 | |
| Finland | 1 | 0 | |
| France | 6 | 0 | |
| Germany | 10 | 0 | |
| India | 2 | 0 | |
| Italy | 2 | 0 | |
| Japan | 20 | 0 | |
| Malaisia | 8 | 0 | |
| 362 Total deaths | Nepal | 1 | 0 |
| Philipines | 2 | 1 | |
| Russia | 2 | 0 | |
| Singapore | 13 | 0 | |
| South Korea | 15 | 0 | |
| Spain | 1 | 0 | |
| Sri Lanka | 1 | 0 | |
| Sweden | 1 | 0 | |
| Taiwan | 10 | 0 | |
| Thailand | 19 | 0 | |
| United Arab Emirates | 5 | 0 | |
| United Kingdom | 2 | 0 | |
| United States | 11 | 0 | |
| Vietnam | 7 | 0 | |
Source: CNN, National and Provincial Health Authorities (China), other national health agencies; as of 12:00 pm ET on 2 February.
In an attempt to halt the spread of the virus, Chinese authorities imposed an unprecedented lockdown on Wuhan and neighbouring cities, suspending all public transport and preventing residents from leaving without valid reasons. The timing came just before Chinese New Year, when millions of Chinese would typically travel around the country to visit family. As the situation worsened, the official New Year holiday was extended by three days until 2 February, with other cities including Shanghai and Suzhou ordering companies not to reopen for a further week. Various countries have imposed travel restrictions to a varying degree: US, Singapore and Australia are denying entry to all foreign visitors who have recently been to China; New Zealand and Australia are denying entry to foreigners traveling from mainland China; and Japan and South Korea are denying entry to foreigners who visited Hubei.
The virus poses downside risks to China’s short-term growth outlook, with travel, entertainment and retail likely to be most affected, in our view, and the extended factory suspension expected to drag down industrial production and trade. The timing is hardly ideal – recent data had just marked the slowest pace of expansion for China’s economy in nearly three decades.
The impact on longer-term prospects and the rest of the world remains to be seen, as it depends on the duration and severity of the outbreak. Outbreaks like the Coronavirus have not been too uncommon since the start of this century. The SARS outbreak of 2003 is perhaps the most similar and widely compared to the coronavirus: the virus belongs to the same family, and it originated in the same country. The first case of SARS occurred in Guangdong, China, in November 2002, but the WHO was not notified until February 2003, when more than 100 people had already died from the virus. On March 2003, the WHO issued a global health alert for SARS, and over the following months the epidemic killed almost 800 people before becoming contained by July. Relative to the coronavirus, the discovery rate of new cases for SARS was much lower (around 8,000 cases over eight months), but with a higher fatality rate (Figure 2).
Figure 2. Coronavirus Versus SARS
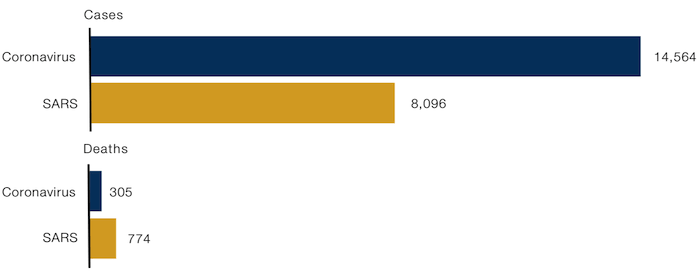
Source: WHO, ECDC, BBC; as of 2 February 2020
However, it may be worth pointing out that SARS occurred more than 15 years ago – the economic and political landscape has inevitably changed since then. In 2003, China’s economy was at an early stage of an export upcycle, with exports growing 35% year-on-year, despite SARS. In more recent times, China’s economic growth has slowed down to a fraction of this, and exports have been hurt by the US trade war. Consumption has become a larger source of growth for the economy, and this is arguably the most under pressure from the outbreak. Policymakers also have less scope for fiscal stimulus, as today China runs a large fiscal deficit.
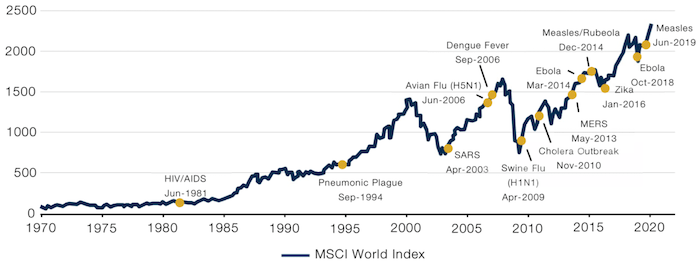
So, what can previous epidemics tell us about moves in financial markets? The impact of SARS on the markets and the global economy was short-lived. During epidemics, equities are typically characterised by a short-term selloff, which has historically been followed by a strong recovery. The drawdowns from SARS (upon the WHO discovering the virus) for the MSCI World, S&P 500, and Stoxx 600 Europe were -5.3%, -3.8%, and -11.1%, respectively. The market moves were similar for Avian Flu (upon the WHO predicting an upsurge of human deaths), with drawdowns of 7.4%, 5.0%, and 6.0%, respectively. However, in the long term, the market has tended to rebound, regardless of the epidemic.
Figure 3. World Epidemics and Global Stock Market Performance
| Market Returns | |||
|---|---|---|---|
| Epidemic | 1-month | 3-month | 6-month |
| HIV/AIDS | -0.46% | -4.64% | -3.25% |
| Pneumonic Plague | -2.79% | -4.67% | -4.30% |
| SARS | 8.64% | 16.36% | 21.51% |
| Avian Flu (H5N1) | -0.18% | 2.77% | 10.05% |
| Dengue Fever | 1.07% | 7.09% | 9.68% |
| Swine Flu (H1N1) | 10.90% | 19.73% | 39.96% |
| Cholera Outbreak | -2.35% | 7.02% | 13.61% |
| MERS | -0.29% | 2.15% | 8.58% |
| Ebola | -0.09% | 2.37% | 4.37% |
| Measles/Rubeola | -1.71% | 1.92% | 2.29% |
| Zika | -6.05% | -0.88% | -0.57% |
| Ebola | -7.42% | -13.74% | -3.49% |
| Measles | 6.46% | 4.51% | 12.02% |
| Average | 0.44% | 3.08% | 8.50% |
Source: Charles Schwab, Factset data; as of 21 January 2020
Figure 4. World Epidemics and Global Stock Market Performance
| Epidemic | Date | MSCI World 6-month returns | S&P 500 6-month returns |
|---|---|---|---|
| SARS | April 2003 | 21.5% | 14.6% |
| Avian Flu (H5N1) | June 2006 | 10.1% | 11.7% |
| Swine Flu (H1N1) | April 2009 | 40.0% | 18.7% |
| MERS | May 2013 | 8.6% | 10.7% |
| Ebola | March 2014 | 4.4% | 5.3% |
| Zika | January 2016 | -0.6% | 12.0% |
As of 30 January 2020. Market data provided for illustrative purposes only. Statements concerning financial market trends are based on current market conditions, which will fluctuate. There is no guarantee that markets will perform in a similar manner under similar conditions in the future.
In general, 10-year rates fall (i.e. bonds rally) in times of an epidemic. During SARS, the Avian Flu, the US 10-year yield fell 38 basis points and 3bp, respectively. In all cases, the curve flattened, with the 2-year yield changing -23bp, +9bp and -12bp, respectively. The behaviour of the US dollar (DXY Index) is mixed in historical scenarios. For SARS, the dollar weakened 2.1%, but in the case of Avian Flu, it strengthened by 2.9%.
The effect on commodities is also mixed. During SARS, Brent crude rallied 7.0%, whereas gold fell by 4.7% and the Bloomberg Commodity Index was flat at 0.8%. In contrast, for Avian Flu, Brent crude fell 5.8%, gold fell 11.49% and commodities fell 7.6%.
Are UK Bulls Justified?
In light of the UK election and Brexit finally happening, are the bullish views for UK equities from the Street justified?
To answer that, we looked at the four components of returns decomposition – margin expansion, other EPS growth, multiple expansion and cash return to shareholders – of the UK mid-cap sector since the 2007 peak, and compared it with other regions (Figure 5).
As illustrated, margins in the FTSE 250 Index have contracted by 410 basis points, with other EPS growth picking up the slack. Multiple expansion contributed 510bp to the returns, while cash returns to shareholders contributed 360bp. With all the returns driven mainly by multiple expansion, we would like to see evidence of operational efficiencies driving margins higher to justify the bull case. A productivity revolution – the new government’s blue-sky scenario – would certainly help.
In comparison, the US has seen positive margin expansion, improved other earnings growth, multiple expansion and dividend growth. As we have previously pointed out, Japan remains the unloved region, with multiple contraction despite increased margins, earnings and dividends. If Europe were a stock, we’d wonder whether we’d want to own it at all, with all the returns driven by multiple expansion and cash return to shareholders.
Figure 5. Returns Decomposition
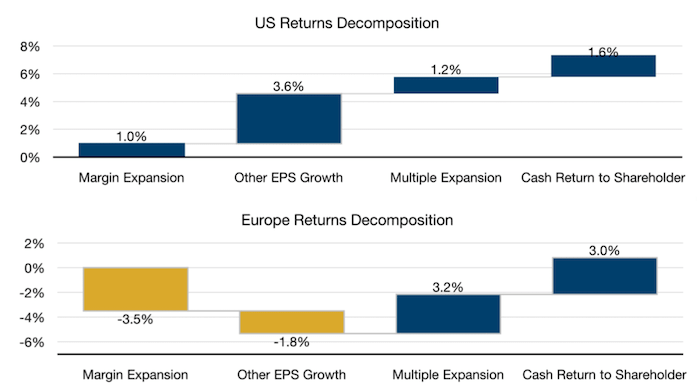
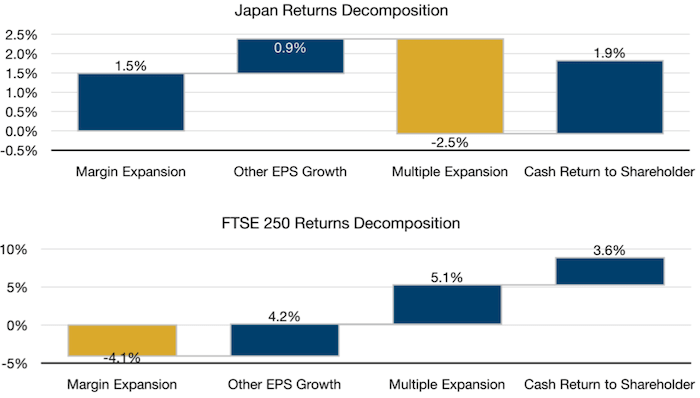
Between 29 June 2007 and 31 December 2019. Market data provided for illustrative purposes only. Statements concerning financial market trends are based on current market conditions, which will fluctuate. There is no guarantee that markets will perform in a similar manner under similar conditions in the future.
With contribution from: Matthew Sargaison (Man AHL, CIO and co-CEO), Faisal Javaid (Man FRM, Head of Investment Risk), Martin Luk (Man FRM, Analyst), and Ed Cole (Man GLG, Managing Director – Equities).
1. Source: CNN, National and Provincial Health Authorities (China), other national health agencies; as of 2 February 2020.
You are now leaving Man Group’s website
You are leaving Man Group’s website and entering a third-party website that is not controlled, maintained, or monitored by Man Group. Man Group is not responsible for the content or availability of the third-party website. By leaving Man Group’s website, you will be subject to the third-party website’s terms, policies and/or notices, including those related to privacy and security, as applicable.