Predictions Galore!
Christmas is only 17 days away. Which means that inboxes are full of strategists’ predictions and recommendations of winning trades for the next year.
We looked at five brokers’ recommendations (and recognise that this isn’t an exhaustive list at all). Four of the five brokers had cross-asset predictions, while one was purely equities-focused. There were 44 trade recommendations in total (Figure 1). The column on the right of these trades shows the 3-month market-neutral return.
Our analysis tells us:
- There is an enormous bullish consensus. The strategists mostly pick recent winners – 75% of these trades were up in the past three months (we have ensured all are looked at in US dollar terms and are market neutralised);
- Thirty-nine of those 44 trades are, in some form or another, a trade on the opening up of the global economy;
- Three of the five brokers recommend small-cap over large-cap; three recommend shorting the US dollar (and notably the other two brokers didn’t talk about currencies); four of the brokers are bullish on high yield versus investment grade (and the other didn’t talk about credit); three are bullish on the Chinese yuan; and three of the five brokers are recommending the same yield curve steepener trade.
Figure 1. Recommendations and Returns
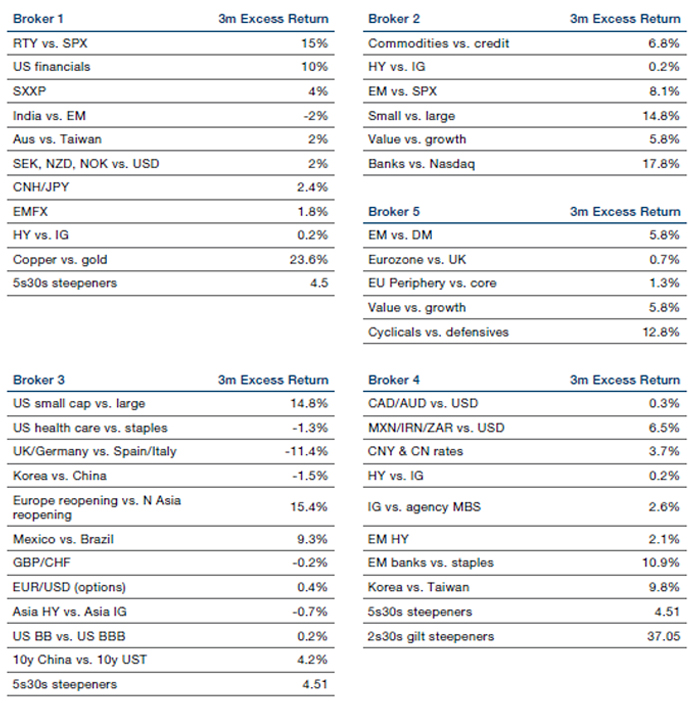
Source: Man GLG; as of 1 December 2020. Past performance is not indicative of future results. Returns may increase or decrease as a result of currency fluctuations.
Why Is There a Fed Put?
The stock of financial wealth on US household balance sheet is astronomical, both in terms of absolute levels, but also in terms of how it’s grown over the past 10-15 years.
There is about USD100 trillion of household assets in the US, or about 4 times nominal GDP. For comparison, Japan is roughly similar while the Eurozone is about half that level.
The composition differs significantly: for Japan and the Eurozone, cash makes up about 57% and 33%, respectively, of total assets; in the US, it’s 16%. Public equities and mutual funds make up 30% of household wealth in the US (Figure 2), 8% in Japan and 13% in Eurozone.
In the US, the stock of public equities and mutual funds held by households has seen a 5% CAGR since the pre-Global Financial Crisis (‘GFC’) peak and a 12.5% CAGR since GFC trough. The growth as a proportion of GDP is also quite extraordinary – 90% pre GFC to 170% at the end of the second quarter of 2020 (Figure 3).
So, there is a ridiculous amount of financial wealth out there, which is skewed towards the US versus other geographies.
Why are we talking about this?
Well, recent discussions with former policymakers underlined the tendency for the Federal Reserve to use its ‘put’. This is something that markets take for granted, and while we don’t dispute it, it’s worth remembering that it is predicated on the presumed wealth effects on consumption. Conventional analysis of consumption assumes it is driven by income, government transfers and wealth. While it is clear that confidence in the upside impact from growing wealth is diminishing, the stock of assets (outlined above) would give any policymaker pause about asymmetric risks to the downside.
But thinking about one of the other contributors to consumption – government transfers – 2020 has been illuminating: cash distributions to lower income households are remarkably effective in supporting consumption, even when job insecurity is high. As such, it seems to us that all roads point back to fiscal expansion as an adjunct to a monetary policy stance that will remain accommodative, and prepared to step in to prevent unwanted negative wealth effects.
Figure 2. US Household Holdings – Public Equity and Mutual Funds (USD Billions)
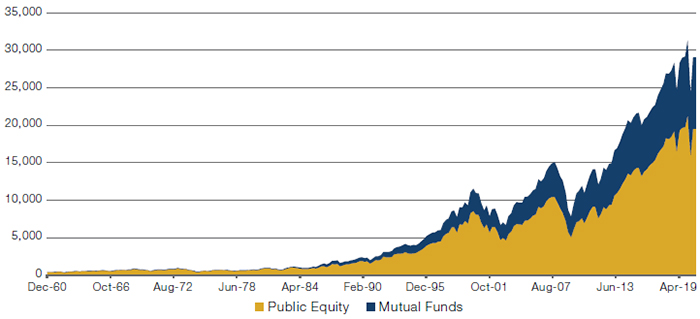
Source: Man GLG; as of 30 June 2020.
Figure 3. US Household Holdings – Public Equity and Mutual Funds (as a % of GDP)
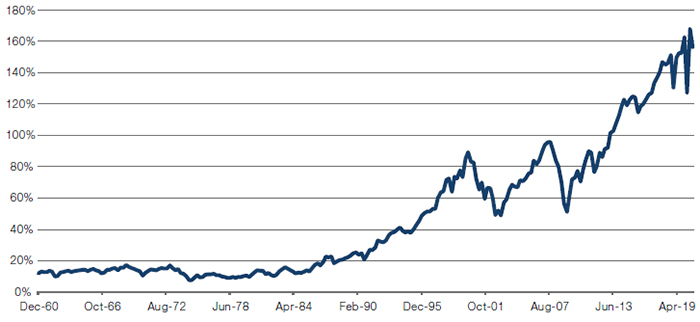
Source: Man GLG; as of 30 June 2020.
Equity Risk: UK Fishing in a Different Pond
As the Brexit trade deal negotiations between the UK and the EU grind on without resolution, Monday morning readers were treated to newspaper headlines attributing the deadlock to a failure to agree on fishing rights.1
Whilst a small contributor in terms of national GDP, fishing rights have become a totemic issue for the negotiations, symbolising wider disagreements about UK sovereignty and its relation to the EU single market between the two parties.
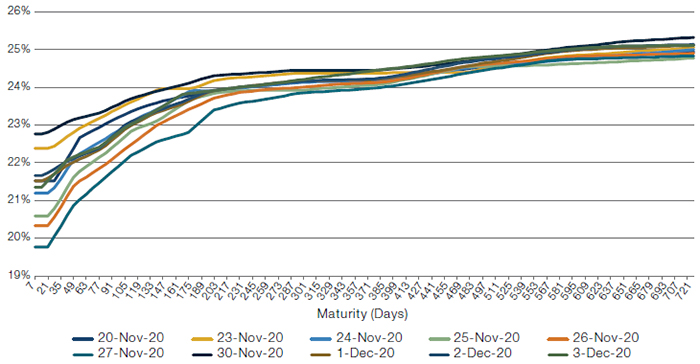
As such, it might be expected that the likelihood of increased trade disruption is a source of near-term risk for equity markets. Investors appear to agree in the case of the FTSE 100 Index, which has seen its variance swap term structure develop a kink– rising at the short end of the curve as more short-term volatility is priced in (Figure 4). In our view, this is what one might expect, with the increased risk of ‘no-deal’ implying greater equity risk over the short term.
However, in contrast, the term structure for the Euro Stoxx 50 and the S&P 500 indices (Figures 5-6) have remained unchanged, with no kink in the curve to reflect potentially increasing short-term equity risk. As such, the market may be reflecting two things. First, that the overall risk to the global economy of a ‘no-deal’ Brexit is limited. And second, the asymmetric nature of ‘no-deal’ risk, with the UK and its equity market by far the most exposed.
Figure 4. FTSE 100 Index Variance Swap Term Structure
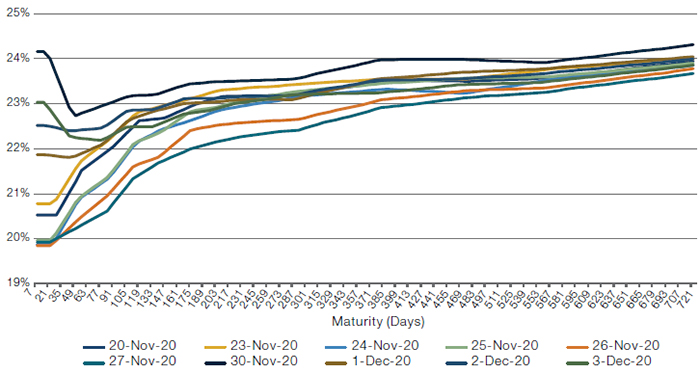
Source: Man AHL; as of 4 December 2020.
Figure 5. Euro Stoxx 50 Index Variance Swap Term Structure
Source: Man AHL; as of 4 December 2020.
Figure 6. S&P 500 Index Variance Swap Term Structure
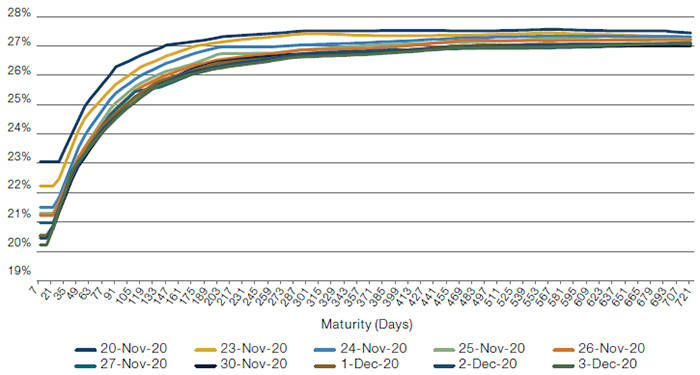
Source: Man AHL; as of 4 December 2020.
With contribution from: Ed Cole (Man GLG, Managing Director – Equities), Russell Korgaonkar (Man AHL, CIO), Samuel Jones (Man AHL, Senior Quant) and Richard Bounds (Man AHL, Head of Volatility).
1. Daily Express, “Barnier Breaks Silence to Declare ‘No Trade Deal’, as Frost Refuses to Back Down on Fishing”, 7 December 2020.
You are now leaving Man Group’s website
You are leaving Man Group’s website and entering a third-party website that is not controlled, maintained, or monitored by Man Group. Man Group is not responsible for the content or availability of the third-party website. By leaving Man Group’s website, you will be subject to the third-party website’s terms, policies and/or notices, including those related to privacy and security, as applicable.