Introduction
The last 5 years have been volatile, to say the least, with global markets getting rocked by a variety of events, including the COVID-19 pandemic, the rise of US interest rates from nearly zero to almost 5.5% to combat inflation, the short-lived US regional banking failure crisis, and increased global geopolitical conflict. It is quite likely that the upcoming US presidential election in 2024 is going to add even more fuel to the fire. While we cannot predict whether volatility will be higher or lower in the future as compared to recent history, we believe that things will be different over the next 5 years as investors look for stability and alpha in an uncertain future that may include another recession.
The most significant difference in the coming years will be the ‘higher for longer’ interest rate environment that the Federal Reserve has been guiding the market towards. The higher rate environment has had, and will continue to have, significant knock-on effects, as the market looks to adjust to the new normal from an extended period of ‘free money’ that encouraged risk taking to generate returns. These include declines in durationsensitive fixed income securities, including US Treasuries, a sharp drop in M&A volumes and valuations, rising default rates because of borrowers’ debt service burdens nearly doubling, and the threat of a pending recession as the Fed looks to combat inflation by reducing consumer spending by keeping interest rates high.
Private credit – specifically middle market, sponsor-backed direct lending – is potentially uniquely positioned to weather any coming storm while providing attractive risk-adjusted returns thanks to a number of structural factors, including:
- downside protection by being structured as 1st lien senior secured loans at the top of the capital stack with financial maintenance covenants,
- floating-rate coupons that provide income with an embedded hedge against inflation and interest rate risk,
- significant access to borrowers and their management teams that allows for deepdive due diligence and portfolio monitoring,
- smaller lending clubs vs. broadly syndicated issuances that allow for more efficient and effective portfolio management, and
- operational and financial support provided by sophisticated private equity sponsors.
We believe that these supporting factors will be incredibly valuable for the asset class over the next 5 years and beyond. Of course, the asset class is not without its risks. We will discuss key areas we think investors should focus on below.
Private credit funds emerge as banks retreat
The market opportunity for direct lending has evolved over the past three decades as traditional lenders, namely the commercial banks, have continually reduced their willingness to originate and hold significant amounts of leveraged loans to middle-market businesses. This secular shift accelerated after the Global Financial Crisis (GFC) as banking regulation and consolidation increased. Post-crisis regulation caused substantial bank deleveraging that required significantly higher levels of bank capital, preventing traditional lenders from profitably lending to small-to-middle market companies. As a result, this trend has pushed banks from holding 71% of the US syndicated loan market in 1994 to just 12% in 20211. Furthermore, this trend accelerated in the middle market LBO financing market in the past decade (Figure 1), which has seen direct lending continue to take share from banks/syndications. This trend is likely to continue in the wake of regional bank failures such as Silicon Valley Bank (SVB) and First Republic, which have prompted renewed regulatory scrutiny and concerns around continued regional bank failures and consolidation.
Figure 1a and 1b. Direct lending takes market share from traditional lenders: increasing ratio of direct lending volume to syndicated loan volume (top) and the decline of syndicated market share over time (bottom)
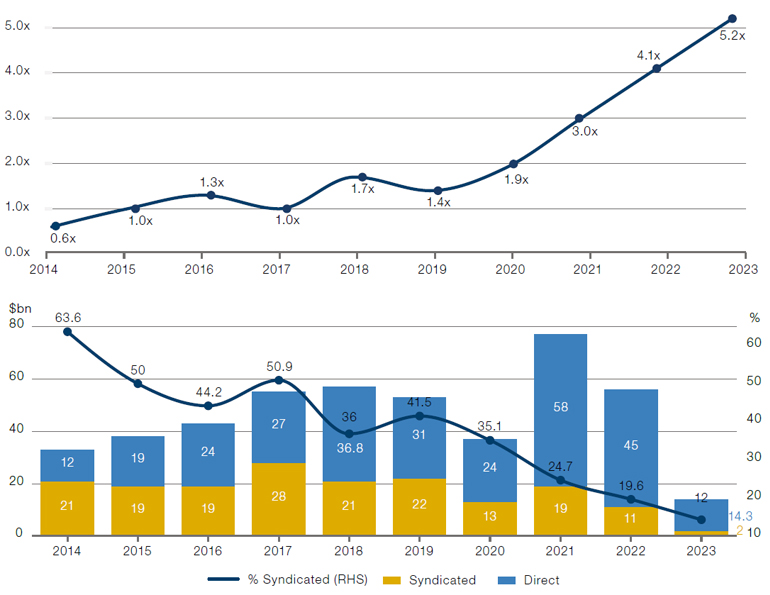
Source: Refinitiv LPC. Direct loans are provided by non-bank lenders to borrowers directly, rather than through a syndication run by commercial banks. These types of loans are not publicly traded. Year-end figures shown except for 2023, which is as at 30 June. Bar chart depicts the volume of syndicated and direct loans by calendar year, in $bn, with the line indicating the proportion of syndicated loans as a percentage of the total.
As traditional lenders have exited direct lending, private equity firms have continued to raise record-breaking levels of capital. In 2023, global private equity dry powder reached $2.5 trillion2. Despite significant interest and fundraising in private credit, there has been $10 of private equity capital raised for every $1 of direct lending capital since 2015 (Figure 2). We believe this gap provides potential long-term tailwinds for private credit, because private equity investments will continue to require capital to fund growth, acquisitions, recapitalisations, and/or refinancings of existing debt facilities, and private equity sponsors will seek to leverage their equity investments with secured senior and unitranche loans from the private credit market, which has become the primary source of LBO financing.
Figure 2. Capital raised – room for private credit to grow
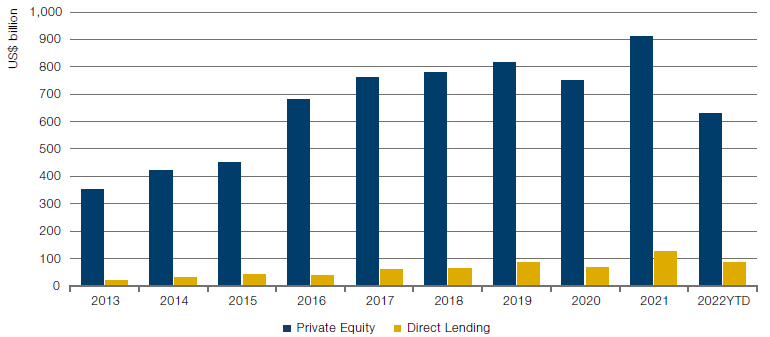
Source: Preqin as of September 2022.
Strong performance vs. other comparable asset classes
In addition to the aforementioned structural changes in the financing markets, private credit as an asset class has delivered attractive returns with low volatility (Figure 3).
Figure 3. Private credit risk-adjusted returns vs other asset classes
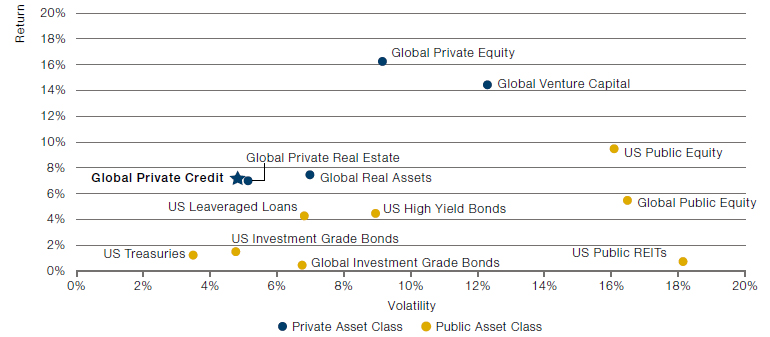
Source: Based on annualised quarterly index returns since 12/31/14 to most recent quarter available; Indices used: Global Private Credit: PitchBook Global Private Debt Index; Global Private RE: NFI-ODCE Index; Global Real Assets: PitchBook Real Assets Index; Global Venture Capital: PitchBook Global Venture Capital Index; Global PE: PitchBook Global PE Index; US Public Equity: S&P 500; Global Equity: MSCI ACWI Index; US REITs: MSCI US REIT Index; US HY: Bloomberg US Corporate HY Bond Index; US IG: Bloomberg US Aggregate Bond Index; Global IG: Bloomberg Global Aggregate Index; US Treasuries: Bloomberg US Intermediate Treasury Index; US Leveraged Loans: Morningstar LSTA Index. Data from Bloomberg and PitchBook Data, Inc.: Data has not been reviewed by PitchBook analysts. Past performance does not guarantee future results.
Senior Direct Lending, in particular, has outperformed traditional credit segments like high yield bonds and leveraged loans, in part reflecting the premium borrowers pay for the efficiency, confidentiality, and flexibility of private capital (Figure 4).
Figure 4. Senior Direct Lending vs Debt Asset Class Returns
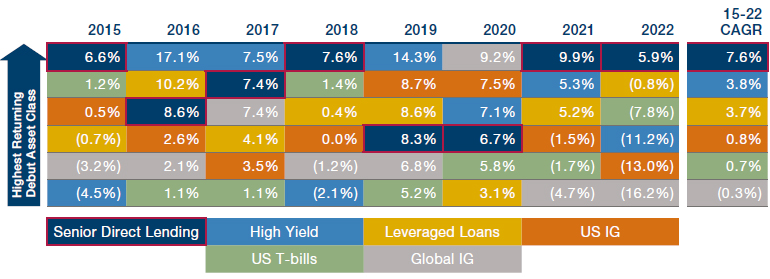
Source: Senior Direct Lending: Cliffwater CDLI-S Index; High Yield: Bloomberg US Corporate HY Bond Index; US IG: Bloomberg US Aggregate Bond Index; Global IG: Bloomberg Global Aggregate Index; US T-bills: Bloomberg US Intermediate Treasury Index; Leveraged Loans: Morningstar LSTA Index. Data sourced from Bloomberg. Past performance does not guarantee future results.
Potential challenges
While some may be calling this the ‘Golden Era of Private Credit’3, high interest rates will present various challenges that managers will have to navigate. We believe the two biggest challenges will be (1) the potential for continued depressed M&A volumes for an extended period of time, which will limit investment opportunities for those managers that do not have strong origination capabilities, and (2) underperformance at the borrower level due to high debt service burdens that constrain cash flows and a potential for reduction in demand as the Fed continues to fight inflation.
1. Depressed M&A Volumes
M&A volumes have experienced significant volatility over the last 5 years. After peaking in 2018, M&A volumes came crashing down from $3.6 trillion to $2.8 trillion in 2020, largely due to COVID-19 lockdowns. This created pent-up demand that was finally realised in 2021, a record-breaking year with $4.6 trillion of deal value and over 43,000 transactions, as noted by PitchBook. Since then, M&A volume has declined around 20% per annum (Figure 5) as higher interest rates have put pressure on valuations.
Figure 5. M&A activity has dropped since a record-breaking 2021
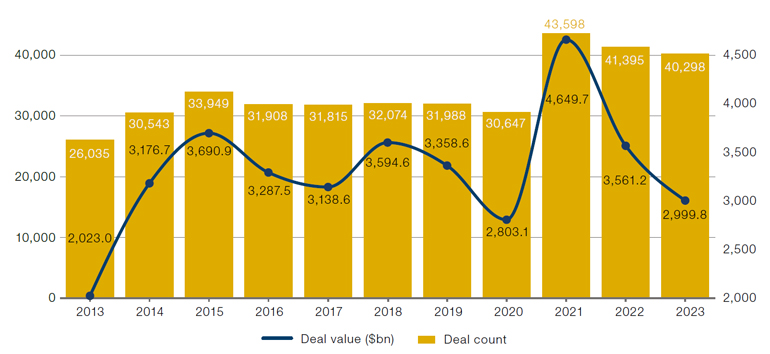
Source: PitchBook Data, Inc.: Data has not been reviewed by PitchBook analysts. Data as at 31 December 2023, deal count for 2023 estimated.
It is important to note that while M&A as a whole is down across the board, the largest drop-off has been in the upper end of the market. As per PitchBook’s 2023 Annual Global M&A Report, M&A deal value to end December 2023 was down 15.8% compared to only a 2.7% decline in deal count. While not immune from broader market trends, we believe the middle market continues to be an attractive segment for investors in terms of both the breadth of opportunities as well as the ability to structure and generate attractive risk-adjusted returns.
The Middle Market Remains Compelling
Middle market companies represent a significant segment of the US economy. There are approximately 200,000 middle market companies in the US, the combined revenues of which, if it were an economy, would rank as the third-largest in the world and which employ approximately 48 million people4. This large and growing sector often requires substantial capital investment to grow, and we believe the demand for debt capital will continue. This growth will be driven by a range of cyclical factors, such as M&A activity, and non-cyclical factors, such as impending maturities of existing middle market debt and the need for organic growth capital. The continued stress in the US banking sector since 2023 will only continue to drive more opportunities for established direct lenders with the size and scale to service this market segment (Figure 6).
Figure 6. Continued need for capital investment
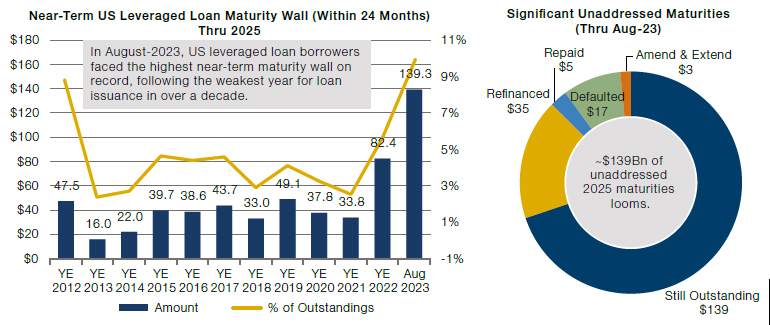
Source: PitchBook Data, Inc.: Data has not been reviewed by PitchBook analysts as at 31 August 2023.
The ‘Core’ Middle Market
As large private credit managers continue to disintermediate banks in the leveraged loan market, two distinct direct markets have recently developed. Many traditional core middle market (EBITDA of $10MM to $75MM) direct lenders have recently moved up-market to finance companies in the lower end of the traditional syndicated loan market (EBITDA of $100MM to $300+MM). This leaves opportunities for direct lenders specialising in the core middle market.
We believe that core middle market loans provide greater safeguards than the broadly syndicated loan market because of smaller lender groups, more active lender involvement, capital structures that typically have lower leverage, and credit facilities with better credit agreement terms. Investors can potentially benefit from managers who are able to negotiate better lender protections including stronger covenant packages, more frequent financial reporting, higher excess cash flow sweep requirements, and higher amortisation payments. These loans generally exhibit lower mark-to-market volatility because of their limited trading compared with broadly syndicated loans, and their ‘originate-and-hold’ nature typically helps reduce the correlation of these investments to public market investments as well (Figure 7).
Figure 7. Middle Market provides better risk-adjusted returns
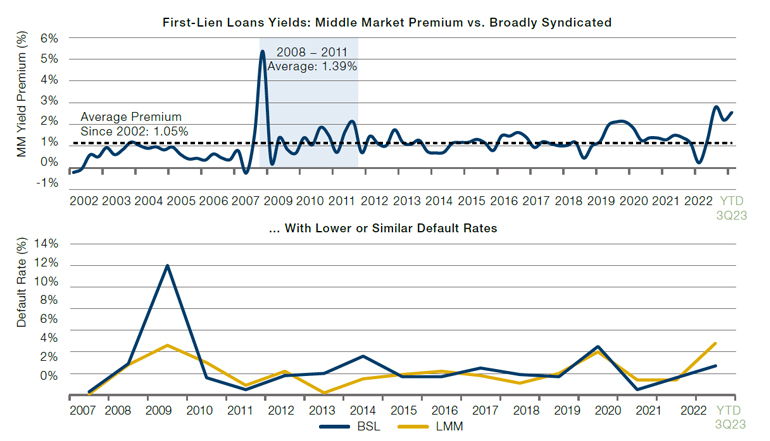
Sources: Refinitiv LPC (top chart) and Fitch Ratings (bottom chart), as at 31 December 2022. Represents 3-year yield premium of Middle Market (borrowers with EBITDA and loan issuances of $500 million or less) vs broadly syndicated market (EBITDA and loan issuances of more than $500 million). Defaults data from Fitch Ratings depicts broad syndicated loans (BSL) and large middle market (LMM) data.
2. Credit Risk Resulting from High Interest Rates and Recessionary Concerns
In order to tackle rising inflation, the Fed has raised interest rates with the goal of slowing demand to match supply. This monetary policy has put financial pressure on businesses and consumers by adding to the burden that everyone is experiencing, with higher cost of living and input prices. There are justifiable concerns that this monetary strategy will lead to deterioration of credit, rising default rates, or even a full-blown recession.
Middle Market managers can address these concerns through credit selection; structuring; being an active, lead lender; and robust portfolio monitoring and management.
Credit Selection:We believe credit selection is the most critical and fundamental element of lending. Investors can protect their downside, particularly during periods of uncertainty, by focusing on lending to companies that generate cash flow, are growing, and operate in non-cyclical, recession-resistant or recession-resilient sectors, including B2B services, healthcare, and B2B providers of established software and technology. Areas to approach with caution include sectors with exposure to end consumers such as retail, restaurants and consumer discretionary. While interesting opportunities can be found in cyclical end markets, we do not believe the market adequately compensates investors for the additional risk.
When looking at yields and defaults in the institutional loan market dating back to the mid-90s, cyclical industries possessed a yield premium versus non-cyclicals of 78bps. However, this was mostly driven by a spike in cyclical sectors during the GFC and COVID pandemic (as shown in Figure 8). Outside these periods, the yield premium for cyclicals was only 31bps. Furthermore, the spikes were primarily driven by selloffs in the broadly syndicated loan markets, which introduced increased volatility. One could argue that the middle market benefits from not being exposed to such volatility.
Figure 8a and 8b. Non-cyclicals more defensive than cyclicals
Problems loading this infographic? - Please click here
Problems loading this infographic? - Please click here
Source: LCD, a part of PitchBook. Spread to maturity data to June 2022. Cyclical industries = Building & Development, Home Furnishings, Hotels & Casinos, Leisure, Retailers (excl. Food & Drug). Non-Cyclical industries = Aerospace & Defence, Business Equipment & Service, Chemicals/Plastics, Containers & Glass Products, Food Products, Healthcare.
In addition, cyclical industries averaged realised default rates of 7.25%, nearly three times the rate of defaults for non-cyclical industries of 2.61% over the same period (Figure 9).
Figure 9. Cyclicals show greater default rate
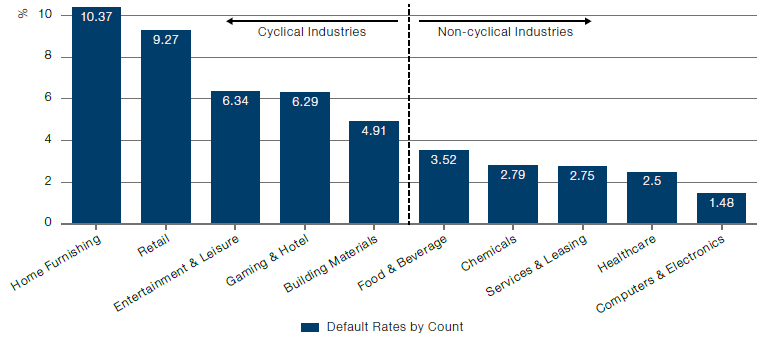
Source: LCD, a part of PitchBook. Cyclicals from the left are Home Furnishing through to Building Materials. Cyclical default rate = 7.25% while Non-cyclicals have a default rate of 2.61%.
Structuring: Structural considerations are another critical element of maximising downside protection.
We have discussed the importance of floating rates, which provide a hedge against inflation and interest rate risk and have resulted in very attractive yields and risk-adjusted returns for 1st lien loans in today’s market. However, it is important that coupons on loans be paid in cash rather than being paid in kind (PIK). A recent trend in the market is lenders increasingly allowing borrowers to pay a component of the interest rate as PIK. While oftentimes marketed as ‘yield enhancement’, PIK interest often is an indicator that the borrower does not have sufficient liquidity cushion (or cash generation) to pay the interest in cash when it falls due. An analysis of public business development company (BDC) filings shows that PIK income accounts for as much as 12% of interest income for certain BDCs (Figure 10).
Figure 10. BDC payments in kind, %
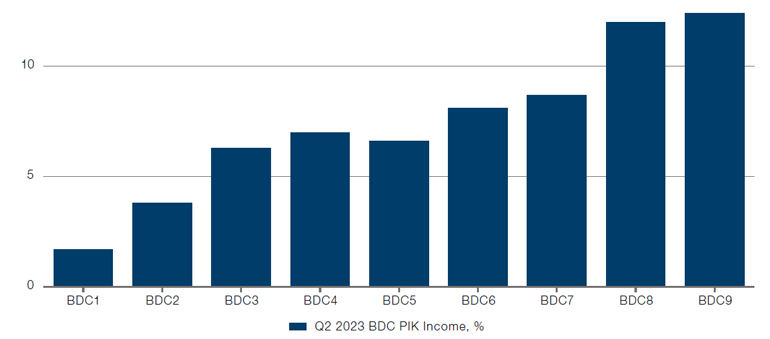
Source: Man Varagon, SEC filings and earnings presentations as of 30 June 2023. The BDCs represent top-tier publicly traded BDCs with greater than $500 million market capitalisation that Man Varagon believes have similar businesses and investment strategies to those of Man Varagon, primarily focused on senior loans to performing, sponsor-backed companies and underlying portfolios with similar characteristics to Man Varagon’s portfolio. Some of the BDCs may invest in loans to larger companies or in a higher proportion of junior debt but are otherwise similar to Man Varagon in strategy.
Active Lead Lender Role: There are several potential advantages for managers that take an active lead lender approach, including greater access to management and sponsors (which in turn allows for greater access to information and depth of due diligence), greater ability to influence the terms and structure of the transaction (including receiving superior deal economics), and a greater ability to influence the management of the transaction on a post-close basis (especially in a restructuring situation).
Figure 11. Lead lenders enjoy several potential advantages
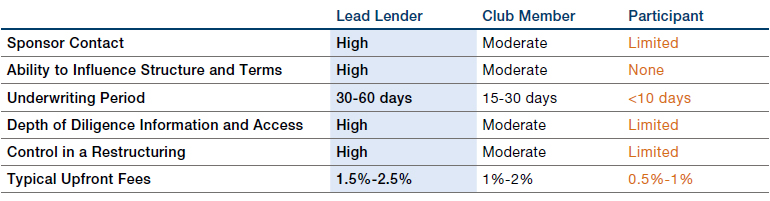
Source: Man Varagon, as at 30 September 2023.
Robust Portfolio Management: The importance of active portfolio management cannot be understated, especially during times of economic stress and uncertainty. It is no surprise that default rates are on the rise given the sharp increase in interest rates, which has put pressure on borrowers’ abilities to service the debt loads that they took on when rates were near zero.
Figure 12. Default rates are finally ticking up

Source: LCD. Morningstar LSTA index, as at 30 September 2023, LTM = last 12 months defaults.
It is possible to address this through structuring deals with robust reporting requirements. Monthly, rather than quarterly reporting can help keep managers apprised of the latest developments in near real time and move quickly when necessary. We also think there is no substitute for experience: knowledge of restructurings and workouts, both from the perspective of being lenders to troubled companies, as well as that of being restructuring and financial advisers to distressed borrowers and creditors, is invaluable. We believe incorporating these experiences into the investment process from the initial underwrite through the life of the deal is critical to mitigating the risk of underperformance. Having a robust portfolio management process that calls for monthly and quarterly reviews of the portfolio by name and at an aggregate level can help managers identify, monitor, and plan for any emerging themes.
We strongly believe that being as ‘close to the assets’ as possible has been, and will continue to be, critical when it comes to managing downside risk.
Conclusion
In the face of interest rates remaining high for an extended period of time, we believe that core middle market, sponsor-backed direct lending provides a compelling investment opportunity that is well positioned to capitalise on current and future market conditions. We believe that managers that can directly originate and lead transactions and are focused on credit selection, prudent deal structures, and active portfolio management will outperform managers that take a more passive approach.
1. S&P Global Market Intelligence, “LCD’sQuarterlyLeveragedLendingReview:4Q21.
2. Source: S&P Global Market Intelligence report, https://www.spglobal.com/marketintelligence/en/news-insights/latest-news-headlines/private-equity-firms-face-pressure-asdry-powder-hits-record-2-59-trillion-79762227
3. https://www.privatedebtinvestor.com/why-its-the-golden-era-of-credit/
4. Sources: Middle Market Indicator Mid-Year 2023 report, National Center for the Middle Market: : https://www.middlemarketcenter.org/Media/Documents/MiddleMarketIndicators/2023-Q2/FullReport/NCMM_MMI_MID-YEAR_2023_WEB.pdf and GDP by country from The World Bank database: https://data.worldbank.org/ indicator/NY.GDP.MKTP.CD?most_recent_value_desc=true&view=chart
Index definitions
The PitchBook Global Private Debt Index, PitchBook Real Assets Index, PitchBook Global Venture Capital Index and PitchBook Global PE Index are quarterly return benchmarks for the private market industry. These indexes are built with PitchBook’s fund cash flow and NAV data for global private debt, real assets, global venture capital and global private equity respectively.
S&P 500, or Standard & Poor’s 500 Index, is a market-capitalisation-weighted index of 500 leading publicly traded companies in the US.
MSCI ACWI Index is a global equity index that captures large- and mid-cap representation across 23 Developed Markets (DM) and 24 Emerging Markets (EM) countries.
MSCI US REIT Index is a free float-adjusted market-capitalisation-weighted index that is comprised of equity Real Estate Investment Trusts (REITs).
Bloomberg US Corporate HY Bond Index; measures the USD-denominated, high yield, fixed-rate corporate bond market. Securities are classified as high yield if the middle rating of Moody’s, Fitch and S&P is Ba1/BB+/BB+ or below.
Bloomberg US Aggregate Bond Index measures the performance of the overall U.S. dollar-denominated bond market. Securities must be fixed rate, U.S. dollar-denominated, taxable and rated investment grade.
Bloomberg Global Aggregate Index is a flagship measure of global investment grade debt from 28 local currency markets. This multi-currency benchmark includes treasury, government-related, corporate and securitised fixed-rate bonds from both developed and emerging markets issuers.
Bloomberg US Intermediate Treasury Index measures US dollar-denominated, fixed-rate, nominal debt issued by the US Treasury with maturities of more than 1 year but less than 10 years to maturity.
Morningstar LSTA US Leveraged Loan Index is a market-value weighted index designed to measure the performance of the US leveraged loan market.
Cliffwater CDLI-S Index is the Cliffwater Direct Lending Index, an asset-weighted index of approximately 14,000 directly originated middle market loans.
NFI-ODCE Index is a capitalisation-weighted, gross of fee, time-weighted return index of open-end funds across the Diversified Core Equity style that typically reflects lower-risk investment strategies using low leverage and generally represented by equity ownership positions in stable US-operating properties.
You are now leaving Man Group’s website
You are leaving Man Group’s website and entering a third-party website that is not controlled, maintained, or monitored by Man Group. Man Group is not responsible for the content or availability of the third-party website. By leaving Man Group’s website, you will be subject to the third-party website’s terms, policies and/or notices, including those related to privacy and security, as applicable.