Introduction: Notes on a Small Island
To understand the current state of British housing, we must firstly outline several key aspects of British life. The first is that Britain is a relatively small and crowded island. Britain’s population, at 66.65 million, is almost exactly the same as that of France (67.06 million), but at just under 210,000 km2, it is less than a third of the size of its neighbour across the Channel. What’s more, that population is heavily concentrated in the prosperous South East of England, with population density ranging from 5,700 people per km2 in London to fewer than 50 people per square kilometre in the most rural local authorities of the UK. The historical dominance of London and the South East in terms of wealth and quality of life was accentuated by the rise of the City of London as the preeminent global financial hub in the 1980s. The story of UK housing affordability is a complex, regional one, as Figures 1-2 showing recent average prices for London and the less affluent North East, illustrate.
Figure 1. Average House Prices – London
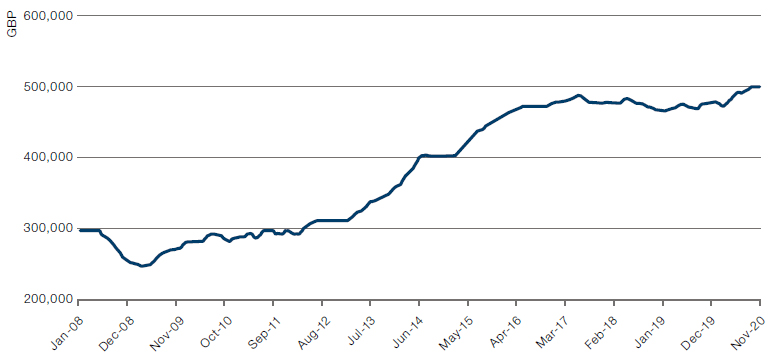
Source: Property Data; as of 21 April 2021.
Figure 2. Average House Price – North East of England
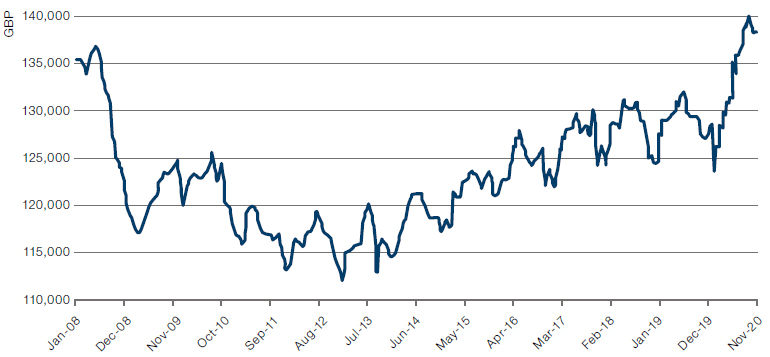
Source: Property Data; as of 21 April 2021.
Describing a Functioning Housing Market
We might start by expressing what we’d expect a functioning housing market to look like. It would be one in which supply of housing was sufficient to meet the demand for it. One in which housing for all levels of the income scale was warm, safe, sufficiently spacious and constructed of materials of adequate quality to ensure long-term durability. It would be one in which there was sufficient choice at reasonable levels of affordability for both renters and homeowners.
Valuations would be largely consistent across the country, making moving for reasons of work or family feasible. It would offer both relative security for tenants and legal protection for landlords. It would, most importantly, be a market in which those on an average income could afford to live in affordable homes within a reasonable distance of their place of work.
The Reality
The UK falls down on almost every aspect of the model housing market above. Affordability levels are more stretched than at any time in modern history. The national picture is dire – with median properties rising from 4.5x median houshold income in 1996 to almost 8x currently.
Figure 3. Average UK Property Prices
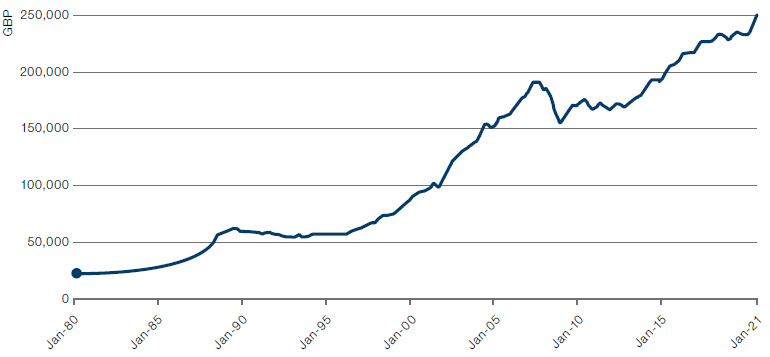
Source: ONS, Land Registry; as of January 2021.
Locally, the picture is even more stretched, with the South East seeing median property prices at 10x median earnings, London at 13x, and certain London boroughs at almost 30x. This leaves ownership in these areas outside all but the wealthiest inhabitants. One of the key drivers behind the 160% increase in house prices across the country since 1996 has been the sharp fall in mortgage interest rates, which have declined from around 8% to under 2% today.
Figure 4. Average UK Mortgage Rates
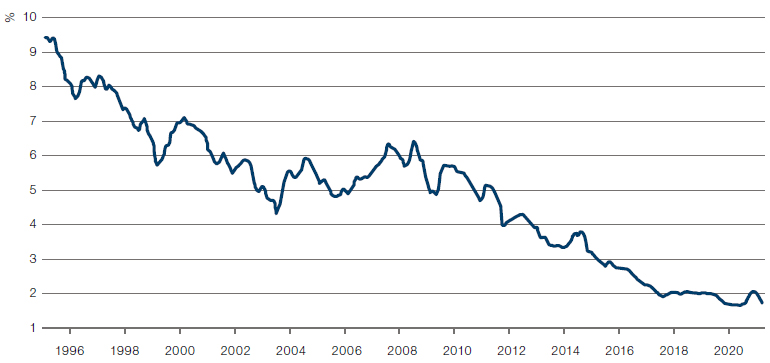
Source: Bank of England; as of 31 December 2020.
The national picture is dire – with median properties rising from 4.5x median houshold income in 1996 to almost 8x currently.
This has impacted the UK housing market in several ways. Firstly, it has enabled mortgage holders to pay off their mortgages early, leading to an increase in outright ownership of property; secondly, it has driven rental yields down (given that landlords are receiving cheaper financing on their debt); finally, it has increased the attractiveness of UK property as an investment asset.
It is this last aspect that seems most powerfully to be impacting the affordability of UK housing, particularly in London and the South East. A 2018 IMF paper entitled ‘House Price Synchronization: What Role for Financial Factors?’ looked at the problems created by the increasing demand for residential property in secure and financially stable cities from international investors. Much of the rise in London property can be put down to its attractiveness to investors from China, Russia and the Middle East looking to invest in an asset class that has demonstrated stong growth and is protected by a well-tested legal system.
Demographics have not helped UK housing’s numerous issues. The population has grown in recent years – by some 8 million since 2000. There are more empty homes than at any time on record – 2020 saw a rise of some 42,000 long-term empty properties, bringing the overall figure to just under 270,000. There are a further c.300,000 short-term unoccupied properties. More adult children live with their parents than ever before, with 46% (or 1.1 million) more 20-34 year olds living with their parents now than in 2002. This, of course, is largely down to the fact that these young people are unable to afford property themselves. Such data jar with the fact that more than half of all UK homeowners lived with empty bedrooms last year, while the number of people living alone has risen sharply, from 6.6 million in 1999 to 8.2 million now.
Figure 5. Percentage of UK Homeowners with Spare Bedrooms
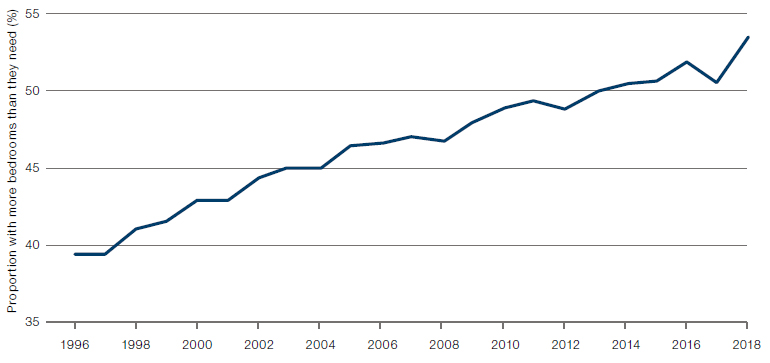
Source: Ministry of Housing Communities & Local Government, Bloomberg; as of December 2018.
The British housing model is not serving those who earn at or below median incomes.
Demographic pressures and the rise in foreign investment in residential property have coincided with a significant reduction in government investment in social housing. We outline the history and present status of social housing in the UK in the next chapter, but it is clear that, while there remains a safety net for the neediest in society, the British housing model is not serving those who earn at or below median incomes. The significant increase in private rentals can be explained by the twin facts of rents that have risen slower than median income in the past 20 years1, and that spiralling property prices have meant that many who might wish to purchase properties have been unable to do so and resorted to rental instead.2
Figure 6. Distribution of Housing in Great Britain (excludes Northern Ireland)
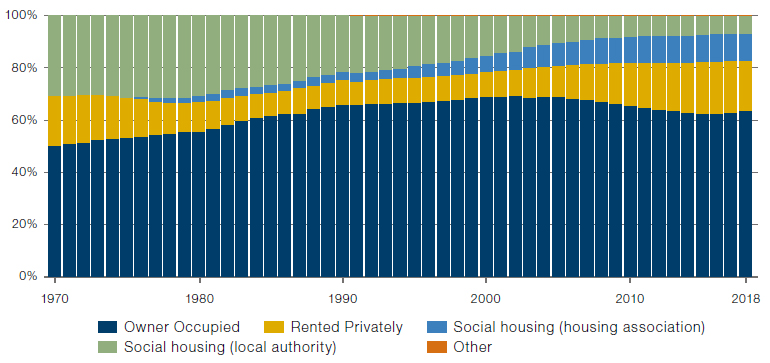
Source: The Guardian, Ministry of Housing, Communities & Local Government, ONS; 1970-2018.
Note: Figures unavailable for Northern Ireland.
All this brings us to 2020, and the coronavirus pandemic, which has served to sharpen many of the inequities of the UK housing market. Prices continued to rise throughout the pandemic, although it is too soon to tell what impact the move to home working will have on the discrepancy between London prices and elsewhere in the country. Nor is it yet clear how seriously to take the Conservatives’ promises to “level up” left-behind areas of northern Britain and what they might mean for house prices. What is clear is that there has been significant focus on the fact that many of those providing frontline services during the pandemic are unable to live in the communities they are serving.
We often employ the image of a ladder to represent the housing needs of the different income groups of the British population. Sixty years ago, almost half that ladder lived in social housing. That figure has steadily declined, with initially owner-occupied making up the difference (a reflection of Margaret Thatcher’s ‘Right to Buy’ scheme), then private rentals (indicative of soaring house prices and the rise of residential property as an investment class). Now, less than 20% of the population live in social housing. What is crucial to understand, though, is not only that the distribution of different housing tenures on the ladder has changed, but that, without wishing to over-work our metaphor, the rungs between the ladders have widened. It is now almost impossible – absent a benevolent relative or a lottery win – for those on the lowest rungs of this ladder to climb higher. In a country where property and status have a long and complexly mingled history, this is about more than merely comfortable accommodation; it is about aspiration and social mobility, about the very nature of a fair and meritocratic society.
Conclusion
It is this gap between rungs – between those who are provided with housing by the state and those who are able to pay market prices for adequate homes – that we are focused on.
Whenever there’s a precipitous rise in a particular asset, it’s worth thinking about what happens to those who don’t participate in the upside, to those who by choice or chance weren’t homeowners during the wild house price inflation of the past two decades, and saw the dream of home ownership slide slowly out of sight. So it is that a wide swathe of those earning lower to middle incomes; young people at the start of their careers; and those in professions such as education, nursing, the arts and other less-well-remunerated jobs, while not qualifying for social housing, are unable to afford decent homes in convenient locations. It is this gap between rungs – between those who are provided with housing by the state and those who are able to pay market prices for adequate homes – that we are focused on. It is this left-behind cohort that suffers most from the distortions and iniquities of Britain’s broken housing system.
1. Which is in itself a reflection of the increasing predominance of investment properties, particularly in major cities.
2. It should be noted that, particularly since the ‘Right to Buy’ drive of the 1980s, in which council tenants were encouraged to purchase their homes, ownership of property has become a fetishized signifier of British identity. This is accentuated by the fact that British renters tend to have significantly less security than those in Europe.
You are now leaving Man Group’s website
You are leaving Man Group’s website and entering a third-party website that is not controlled, maintained, or monitored by Man Group. Man Group is not responsible for the content or availability of the third-party website. By leaving Man Group’s website, you will be subject to the third-party website’s terms, policies and/or notices, including those related to privacy and security, as applicable.