Introduction
Historically, similar stretches of low vol underperformance have led to quick recoveries and we believe this time will be no different.
Low Volatility (‘low vol’) helped mitigate downside risk during the first quarter of 2020, but has since faced significant headwinds as the market has staged an incredible rally. Indeed, low vol strategies have had an incredibly rough patch. In March 2020, generic low vol (as defined by the top US 500 stocks ranked by capitalisation) provided only mediocre protection against falling markets and has significantly lagged the capweighted S&P 500 Index.
Understandably, investors have started to question the low vol phenomenon and the relevance of the style in a market that has generously rewarded pro-beta and pro-risk concepts. However, it is crucial to fully contextualise this poor performance; indeed, it remains imperative that we judge low vol against cap-weighted benchmarks and other styles only over a complete cycle. Historically, similar stretches of low vol underperformance have led to quick recoveries and we believe this time will be no different.
Low Volatility Drawdown
As a point of comparison for the recent struggles of the low vol factor, consider low vol’s performance during the technology (‘TMT’) bubble, low vol’s worst historical drawdown. Here we limit the scope of the analysis to the US investment universe to ensure a sufficiently full history. Following the last major drawdown for the low vol factor during the height of the TMT bubble in December 1999, the recovery was sharp. Low vol had crawled about halfway out of its hole within about 18 months (Figure 1).
Figure 1. Low Volatility Drawdown
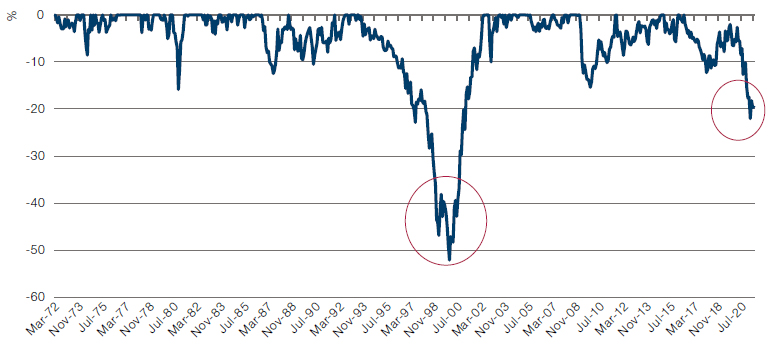
Source: Man Numeric, Bloomberg; January 1968 – September 2021.
Note: Low vol drawdown calculated as US top 500 stocks by capitalisation less S&P 500 Index low volatility US top 500 stocks by capitalisation less S&P 500 Drawdown.
Return Decomposition of Low Volatility
Decomposing the returns to low vol and to the benchmark is instructive in understanding the root cause of underperformance and underpins our current bullish outlook on the low vol concept.
While not low vol’s first drawdown, this current period1 has been defined by unique characteristics which are worth exploring. Relative to the cap-weighted benchmark, one can decompose returns into a few key contributing factors. Specifically, decomposing the returns to low vol and to the benchmark is instructive in understanding the root cause of underperformance and underpins our current bullish outlook on the low vol concept.
In the following analysis, we reference the below decomposition of returns into earnings growth, multiple expansion and dividends:
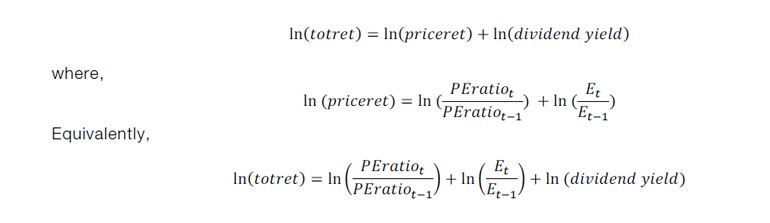
A myriad of factors may convince investors to value a company highly relative to the same level of current earnings. These include changes in growth expectations, economic conditions and investor risk preferences. Intuitively, ‘multiple expansion’, or the growth in price-to-earnings (‘P/E’) ratio, represents this contribution to price return; it captures return contribution derived from changes in valuation unexplained by earnings growth. The second term, earnings growth, accounts for the remainder of price return: it represents the return contribution from growth in current earnings alone, holding changes in the PE ratio constant. Lastly, dividends and other corporate actions, which historically have contributed more to low vol returns than to cap-weighted benchmark returns, are accounted for in the last term. Using the decomposition above, we can answer a few basic questions regarding low vol’s recent struggles and can contextualise them within a historical lens.
The Impact of Earnings
Some natural questions investors ask include:
- The extent to which earnings growth has contributed to low vol returns;
- To what extent this contribution has differed for the cap-weighted benchmark; and
- Whether these relative contributions have changed over time.
Total returns to the S&P 500 from January 2007 to September 2021 handily exceeded those of the low vol portfolio, a natural consequence of the staunchly risk-on global market rally of the 2010s and thus far in the 2020s.
However, earnings growth has been almost identical between the S&P 500 and the low vol portfolio over the 2007 to 2021 period, an indication of either increasingly stretched valuations in the cap-weighted benchmark or relative undervaluation of low vol stocks, or both (Figure 2).
Figure 2. Low Vol Return Decomposition
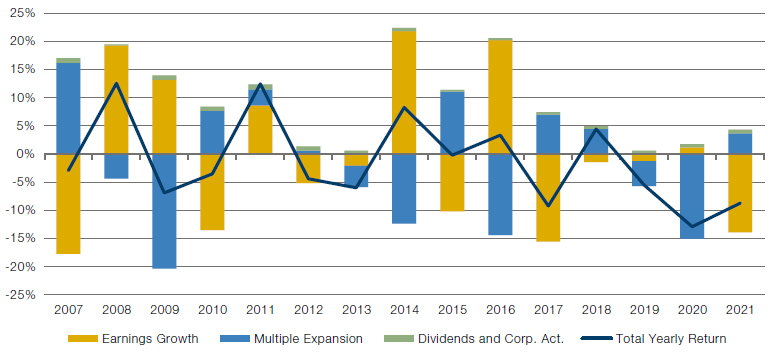
Source: Man Numeric; January 2007 – September 2021.
Note: Low vol return decomposition calculated as US top 500 stocks by capitalisation less S&P 500 Index.
Low vol suffered mightily since the second quarter of 2020, not because its own earnings were not strong, but because our point of comparison enjoyed historically favorable tailwinds.
Comparing the historical quarterly average earnings growth of the low vol portfolio and the cap-weighted benchmark to earnings growth since the depths of the Covid-19 crisis illustrates the unique disconnect faced by the low vol concept during the period (Figure 3). Low vol earnings growth since the market bottom of the Covid crisis has exceeded its historical averages.
Moreover, historical average earnings growth of low vol stocks is actually higher than the historical average earnings growth of the S&P 500 Index as a whole. Comparing earnings growth during the Covid crisis period, however, the S&P 500 Index has experienced perhaps unsustainably strong earnings growth that far exceeds its historical averages. From this perspective, low vol suffered mightily since the second quarter of 2020, not because its own earnings were not strong, but because our point of comparison enjoyed historically favorable tailwinds. The S&P 500 Index remains heavily dominated by mega-cap technology stocks which benefited from Covid-19 with such business models being immune to the shocks created by the crisis. Some of these businesses also benefitted from Covid-19 lockdowns, which led to a widespread trend of working from home. In our view, it is unreasonable to expect this period of unusually high margins will persist. We believe the differential will inevitably revert and, in fact, we have already seen some evidence of this in the first few weeks of 2022. This can potentially position low vol for outperformance at this stage in the business cycle.
Figure 3. Quarterly Earnings Growth – Covid-19 Crisis Period Versus Historical Averages
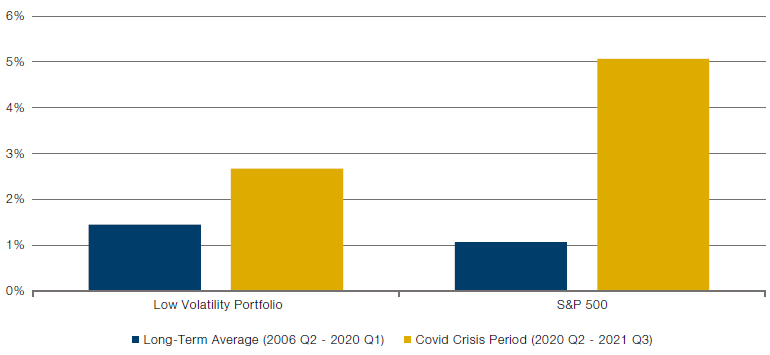
Source: Man Numeric; 2006 – 2021.
Multiple Expansion: How Long Can Valuations Remain Stretched?
In addition to low vol stocks not keeping up with the sharp increase in the S&P 500’s earnings growth, relatively weak multiple expansion for low vol stocks has also been a substantial headwind since the onset of Covid-19. As the most jarring example of this effect, the multiple expansion component of the decomposition was 15 percentage points higher for the cap-weighted benchmark during 2020. A significant portion of the relative multiple expansion effect is explained by recent monetary and fiscal policy interventions. When central banks and governments artificially subdue interest rates and create new money, long-duration assets such as the more speculative names in the cap-weighted indices are disproportionately rewarded. Importantly, this effect is visible primarily in the multiple expansion term of the decomposition, rather than the earnings growth term due to the greater benefit to distantly future cash flows or the current or 12-month forward earnings.
Another way to conceptualise the multiple expansion differential is through the lens of investor appetite. Since the onset of the Covid-19 crisis period, fund flows to the MSCI US Minimum Volatility Index, a large generic low vol investment vehicle, have been staunchly negative (Figure 4).
Figure 4. MSCI US Minimum Volatility Index – Quarterly Fund Flows
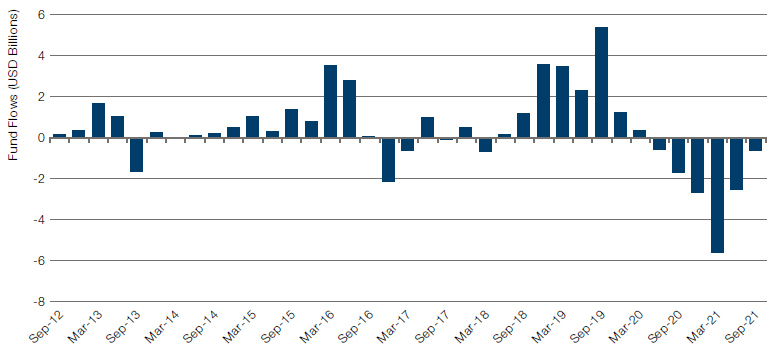
Source: Man Numeric, Bloomberg; 2012 – 2021.
Given this significantly negative headwind, it is unsurprising that the low vol concept has experienced weaker multiple expansion than the broader market. Flows have historically been cyclical, however, and we appear to be nearing the end of an outflow cycle for low vol.
Evolving Low Volatility Characteristics
Aside from the likelihood of receding macro headwinds in the market environment, low vol appears poised to benefit from changing characteristics to its factor composition.
Correspondingly, the relative multiple expansion effect visible in Figure 2 has begun shifting slightly in favour of low vol throughout 2021. As we move into a fairly uncertain market environment with the threat of rising rates and waning fiscal stimulus, the trend could continue further and benefit the low vol factor. Another way to empirically look at it is that after every difficult multiple expansion period for low vol (such as 2009 and 2016), we see a relatively fruitful multiple expansion tailwind.
Aside from the likelihood of receding macro headwinds in the market environment, low vol appears poised to benefit from changing characteristics to its factor composition. Historically, the returns to the low vol factor have also often exhibited period-specific co-movements with other return drivers such as generic value and growth concepts. To illustrate this opportunity more precisely, we consider a portfolio which goes long low beta stocks and short high beta stocks (approximating the low vol factor). The low vol factor is currently exposed to the value concept (more cheaply valued stocks), potentially positioning low vol portfolios to benefit from the valuation opportunity in the near future (Figure 5).
Figure 5. Low Volatility Portfolio Relative Factor Exposure to Barra Value and Barra Growth
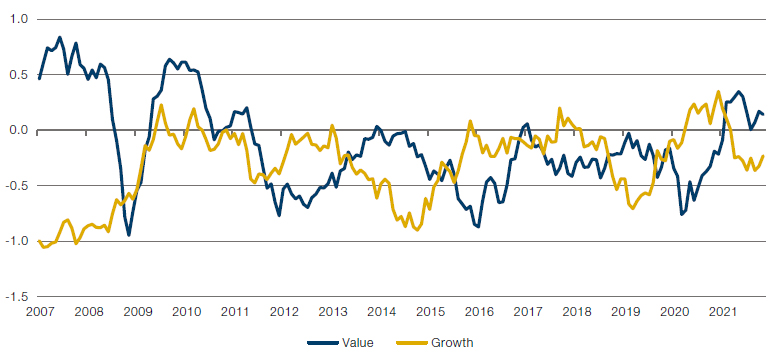
Source: Man Numeric, Bloomberg; 2006 – 2021.
Low vol also appears to be positively exposed to the value factor at an extremely opportune time. Valuation stretch, as measured by our standardised ‘convergence’ methodology remains at historic highs (Figure 6). The convergence metric represents the return opportunity between cheap and expensive stocks should the market converge to valuation parity.
Figure 6. US Large Cap Valuation Stretch
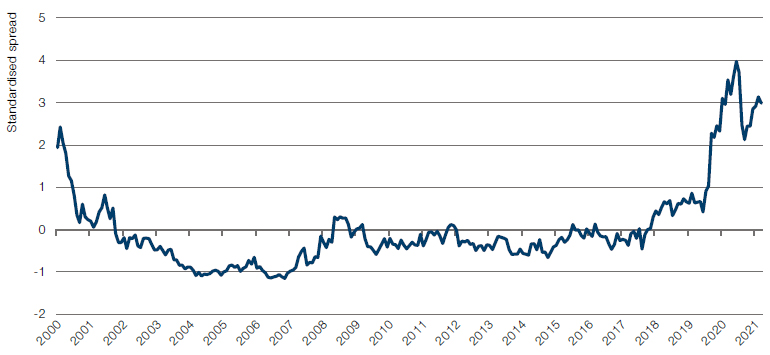
Source: Man Numeric, Bloomberg; July 2000 - September 2021.
The valuation differential between cheap and expensive stocks is historically wide because of an abnormal degree of recent multiple expansion for the pro-risk, progrowth subset of the index, which generally excludes low vol stocks. Given the recent gyrations in rates markets globally and stubbornly high inflation readings, this trend may not persist. We believe that this status quo of abnormally stretched valuations is inherently unsustainable and will revert to the mean over time.
Conclusion
Global markets are at a crossroads, with considerable uncertainty surrounding key macroeconomic developments. Predictions vary wildly on whether inflation will be transitory and the future direction of interest rates. At the same time, major market indices are behaving as if nothing is amiss. Furthermore, while these indices appear stretched in terms of valuation, the difference between the valuations of cheap and expensive stocks remains historically wide.
The result of these effects is an uncertain market outlook, seemingly ignored by investors who, we believe, have not yet appropriately acknowledged the risks. In our view, this backdrop bodes well for the low vol concept in the coming quarters. Low vol’s defensive tilt is intentionally designed to withstand uncertain environments. As a bonus, low vol stocks have not fallen prey to incredibly stretched valuations to the same extent as the broader market, augmenting the concept’s current value proposition and potentially positioning it for outperformance in the coming quarters.
1.March 2020 to date.
You are now leaving Man Group’s website
You are leaving Man Group’s website and entering a third-party website that is not controlled, maintained, or monitored by Man Group. Man Group is not responsible for the content or availability of the third-party website. By leaving Man Group’s website, you will be subject to the third-party website’s terms, policies and/or notices, including those related to privacy and security, as applicable.