Introduction
It’s fair to say that trading has become unrecognisable over the last 50 years, moving rapidly from face-to-face pit trading to a world where electronic trading is ubiquitous. But what is sometimes forgotten is the pace at which industry has continued to evolve during the last decade. With ever-more sophisticated technological advances and efficient data management, investors face increased competition. As such, great efforts have been made to generate returns by exploiting state-of-art algorithms, reducing latency and obtaining access to superior information.
Data has always been an essential driver of trading. It can be broadly categorised into price data, fundamental data and alternative data (such as texts and images).
High-frequency market data is the primary source of price data, and the detailed records of order flow and price dynamics provide a granular description of short-term supply and demand. Such so-called microstructure data has been studied extensively by researchers at the Oxford-Man Institute, including works by Zhang, Zohren, and Roberts (2019) and Zhang and Zohren (2021) that adopt deep learning algorithms to predict high-frequency price movements.
We demystify the inner workings of an exchange by working with a simulator which replicates the matching engine of an exchange.
But understanding how new data and technological changes have affected trading and order flows is easier said than done. Face-to-face pit trading was at least easy to conceptualise; after electronic trading became the norm, market dynamics were still relatively comprehensible. But after the data deluge, it is sometimes hard to know where to begin when discussing the inner workings of modern exchanges.
To remedy this, we give a brief description of microstructure data and demystify the inner workings of an exchange. We do so by working with a simulator which replicates the matching engine of an exchange. The simulator further allows us to interact with order flows instead of just working with static historical observations. The ability to simulate such interactions with the order flow of a market enables us to quantify the expected impact of a specific order and thereby develop execution algorithms which minimise such impact costs.
Apart from replicating the matching logic, the simulator can inspire a range of interesting applications that are specific to high-frequency market data. We demonstrate a use case that investigates the price impact of different order sizes. The simulator can also be deployed to other application domains including trade execution, passive fills for fast trading strategies and general price discovery.
Price Discovery Under the Microscope – Supply and Demand at the Microstructure Level
Most of us are used to standard price series of financial instruments. However, if we zoom in at any given moment in time, as shown in Figure 1, we observe that the price is just a manifestation of the available liquidity at the exchange at that instant. This is represented by the limit order book (‘LOB’) which is essentially a record of all outstanding intentions to trade. Traders can place various types of orders and a limit order allows traders to specify the price and quantity of interest. A limit order only executes if the market price reaches the specified price, otherwise it will stay alive in the order book until expiry or cancellation. On the contrary, a market order is matched immediately but with a higher cost, as it potentially executes against multiple levels in the order book. It is often used when immediate execution is required.
Figure 1. Price Series at 1-Minute Frequency (Left) and LOB Corresponding to a Given Instance of Time (Right)
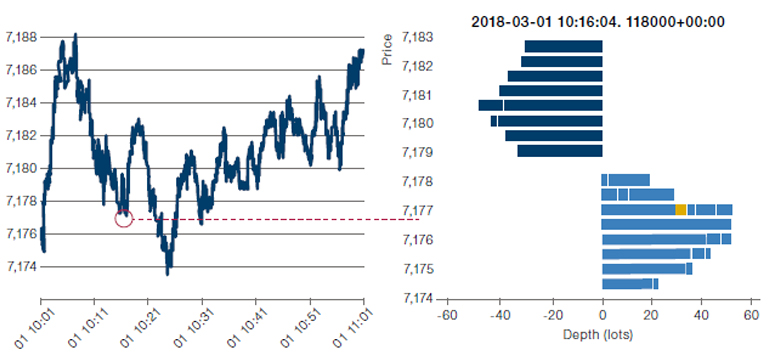
Source: Man AHL. For illustrative purposes only.
Note: Levels in the LOB are made up of resting orders reflecting the supply and demand at that moment in time. The LOB snapshot (right) corresponds to the mid-price shown at the single point of time highlighted (left). Note that in the LOB, by convention, depth is shown positive for buy orders and negative for sell orders.
A LOB is one of the common ways to visualise high-frequency microstructure data. It has two sides: ask and bid, representing all orders to sell and buy, respectively. A LOB is sorted into different price levels based on the submitted orders. The first level of the ask (bid) is known as best ask (bid) because this is the best price level from which a buy (sell) order can be matched – in other words, the best ask (bid) is the lowest (highest) price visible on the orderbook at which a participant is willing to sell (buy).
Overall, a LOB reflects a snapshot of the current market environment and indicates the short-term demand and supply. The LOB data, up to a given depth of the LOB, is sometimes also referred to as level 2 (or simply L2) data among practitioners. L2 data provides more depth than the commonly used L1 data, which only contains the top-ofbook (prices and sizes of best ask and bid), as well as recorded trades.
The Inner Workings of an Exchange
In this section, we illustrate the order lifecycle and demonstrate how an order book is maintained in an exchange. When an order is instructed by a trader, this message will flow through several intermediaries including exchanges, banks, brokers and clearing firms. Exchanges provide access to the ensemble of such messages as a real-time data feed, and the sequence of messages allows for the reconstruction of the LOB.
Market by order data provides a sequence of order instructions from all market participants, each of which describes the action of a specific trader at a given time point.
The full-resolution collection of these messages, which is termed market by order (‘MBO’) data, provides one of the most granular sources of microstructure information. Essentially, MBO data provides a sequence of order instructions from all market participants, each of which describes the action of a specific trader at a given time point. The core components of MBO data1 consist of: time stamps recorded when an instruction is given; a unique and anonymous ID for order identification; and actions that indicate whether the trader is buying, selling or cancelling an existing order. Note that MBO data is sometimes also referred to as level 3 (or L3) data. By replaying L3 data through an exchange simulator, we can reconstruct the L2 data up to any price level – this is the internal state of the matching engine – as well as infer and record trades as contained in the L1 data. As such, L1 and L2 (LOB) data can be viewed as data derived from L3 (MBO) data.
MBO data also shows if an incoming order is a market or a limit order. If a market order is instructed to buy a certain number of shares, it will be matched immediately on the ask side of the LOB, as shown in Figure 2 (top chart). On the contrary, a trader can submit a limit order with specified price and volume on the bid side, as shown in the bottom chart in Figure 2.
At any given time, a market order is more expensive than a limit order because of the spread cross (i.e. the difference between the best ask and bid), paying a premium for immediate matching. A limit order is potentially cheaper, but it requires passive filling since participants must wait until the market reaches the specified price level. During this time, there is a risk of the price moving away. As a result, there is a time uncertainty for filling limit orders. Indeed, this is one of the reasons why a microstructure data simulator is needed, since it allows the study of trading behaviours for high-frequency strategies that require passive filling.
Figure 2. An Illustration of How MBO Data Updates a LOB
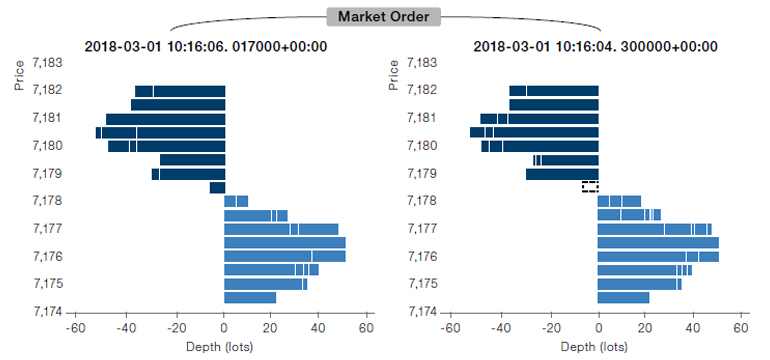
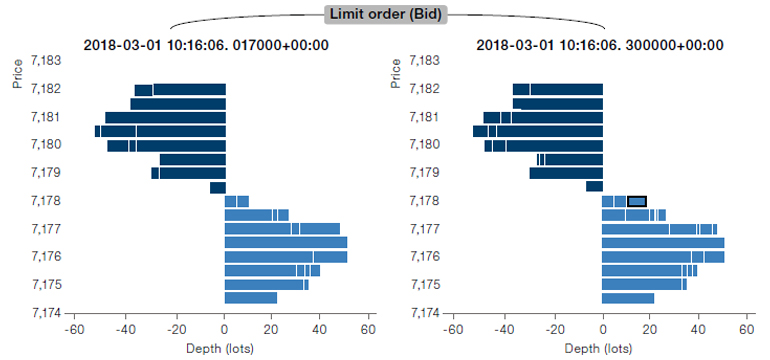
Source: Man AHL. For illustrative purposes only.
Top: A market order of “buy 6 shares” that results in immediate matching at price 7,178.5; Bottom: A limit order “buy 6 Shares at price 7,178” that waits on the LOB for passive filling.
Simulating the Exchange’s Matching Engine
In this section, we introduce a microstructure data simulator by explaining matching rules and presenting an example for passive filling. Figure 3 shows an animation from a simulator that presents how a typical LOB evolves throughout time. A LOB updates whenever a message of MBO data comes in. Note that the time interval is irregular in physical clock time. In general, we expect more updates at the open and close of markets because of larger trading volumes and higher volatility.
Figure 3. A LOB Through a Market Simulator
Source: Man AHL. For illustrative purposes only.
Note: A given limit order is marked in green.
In general, the most common priority mechanism is pricetime, which means that for active orders, priority is given to those with the best price, and ties are broken by selecting the order with the earliest submission time.
Note that several active orders can have the same price at a given time. LOBs employ a priority system for matching active orders at each individual price level. In general, the most common priority mechanism is price-time, which means that for active orders, priority is given to those with the best price, and ties are broken by selecting the order with the earliest submission time. Another priority mechanism is pro-rata, which is popular in some futures markets. Under this mechanism, each relevant active order receives a share of the matched quantity proportional to the fraction of the depth available that it represents at that price. There are also other, less common matching mechanisms.
Our simulation is essentially a replay of the historical messages through an artificial matching engine. To illustrate this, Figure 3 shows the evolution of a LOB and demonstrates the life cycle of a specific order (marked green) from placement to settlement.
Being able to simulate markets to this degree of granularity can be useful in several important applications in execution and fast trading, including:
- Determining fills of passive orders;
- Analysing price impact;
- Building, testing and refining execution algorithms.
Analysis of Price Impact Through Microstructure Simulation
Another use case of the simulator can be illustrated by focusing on the analysis of price impact. Price impact refers to the effect the participant’s own trading has on the price. It is difficult to study in live trading as there is no way of knowing what would have happened had a trade not been placed.
Empirically, we can only observe what happens on average on a large number of orders, where, in absence of trading, the price would move up or down equiprobably. In instances where a trade is conducted, we observe a subtle upward price trend in buy cases and a downward trend in sell cases. The powerful aspect of having a market simulator is that it effectively enables the re-running of different realities where our interventions with the market either do, or do not, occur.
The powerful aspect of having a market simulator is that it effectively enables the re-running of different realities where our interventions with the market either do, or do not, occur.
Note that there are generally two types of price impact. Firstly, there is mechanical or direct price impact. This happens, for example, when a market order to buy is placed. This removes the best ask and, as a result, both the best ask price and the mid-price change. This type of price impact is automatically captured by the simulator as it is a direct consequence of the matching logic. Secondly, there is indirect price impact, which is also referred to as signalling impact. This is where one participant’s actions influence others. In the above example, even if not using a market order, a large buy limit order resting on the best bid would indicate a strong desire to buy, and even though no trading has occurred could encourage sellers on the best ask to cancel their orders and resubmit them at a higher price. Indirect price impact is harder to model, but even simple probabilistic models mimicking the reaction of other traders on a microstructure level can reproduce complex empirical price impact formulas at the aggregate level.
Figure 4 shows the analysis of price impact for varying order sizes obtained using simulation experiments where we replay the past over-and-over again, interacting with the market in different ways. As expected, we observe that the larger the order size, the higher the price impact. More precisely, we see that the functional relationship between order size and impact is well described by a square root. This is in line with a well-known empirical finding, also known as the square-root law, which states that price impact increases with the square root of order size. Interestingly, this empirical formula is not explicitly used. Rather, mechanical price impact and simple probabilistic logic on an order-by-order level naturally give rise to this behaviour in aggregate.
Figure 4. Analysis of Price Impact for Different Order Sizes
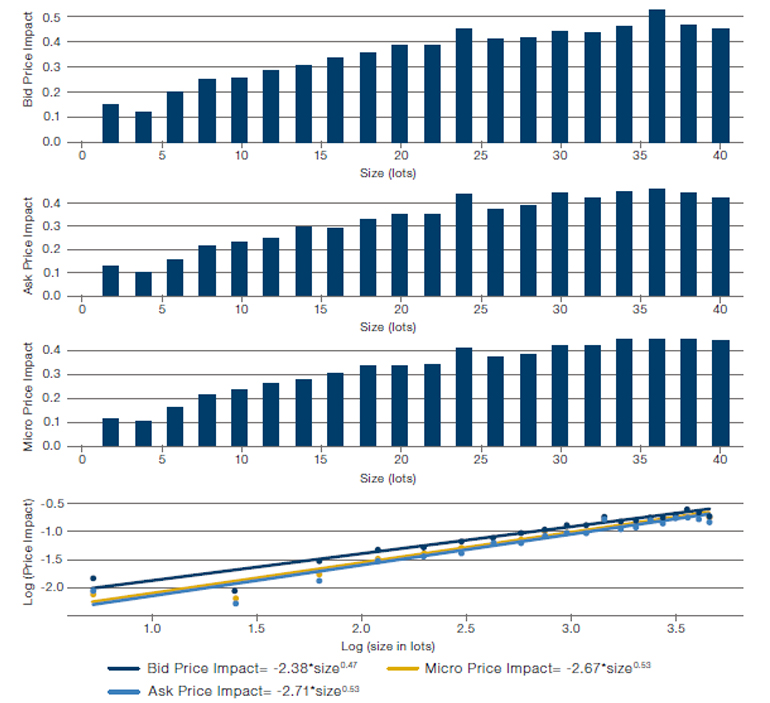
Source: Man AHL. For illustrative purposes only.
Note: When plotting the data on a log-log plot, the well-known square root law of price impact emerges from first principles.
In the absence of a simulator, research is often guided by a combination of intuition, and trial and error. However, learning by trial and error can be a slow and expensive process.
The above results demonstrate the potential cost from executing large orders as less favourable prices are obtained. As a result, execution algorithms play an important role for large investment firms as they split larger orders into sequences of smaller size orders, avoiding severe price impacts and thereby saving costs. The study of such execution algorithms requires an interaction with order books, so the simulator facilitates this type of research by allowing trading behaviours and transaction costs for different execution algorithms to be examined. In the absence of a simulator, research is often guided by a combination of intuition, and trial and error. In the complex world of market microstructure, however, insights that seem intuitively appealing can often turn out to be flawed. Learning by trial and error can also be a slow and expensive process.
Further, the simulator allows the use of agent-based models for general price discovery by explicitly modelling price dynamics. The simulator can be further utilised as an environment for Reinforcement Learning algorithms, directly minimising execution costs through an agent interacting with the environment.
Conclusion
We introduce high-frequency microstructure data and describe the role of limit order books (‘LOBs’) in price formation. Specifically, we demonstrate how a LOB evolves by processing incoming order placements and cancellations, and discuss the order lifecycle within an exchange. We do so by introducing a simulator which replays the various matching rules of an exchange. A use case is presented to demonstrate how the simulator can be used to study price impact for different order sizes, an analysis which is vital for studying execution algorithms. Beyond execution, other important applications include the simulation of passive fills in faster trading strategies.
References
Zhang, Zihao, Bryan Lim, and Stefan Zohren. “Deep Learning for Market by Order Data.” arXiv:2102.08811 (2021). Full paper.
Zhang, Zihao, Stefan Zohren, and Stephen Roberts. “DeepLOB: Deep convolutional neural networks for limit order books.” IEEE Transactions on Signal Processing 67 (11): 3001–3012. arXiv:1808.03668 (2019). Full paper.
Zhang, Zihao, and Stefan Zohren. “Multi-Horizon Forecasting for Limit Order Books: Novel Deep Learning Approaches and Hardware Acceleration using Intelligent Processing Units” arXiv: 2105.10430 (2021). Full paper.
1. The Oxford-Man Institute work of Zhang, Lim, and Zohren (2021) applies deep learning algorithms to MBO data to make predictions. Interested readers are referred to their work for detailed results.
You are now leaving Man Group’s website
You are leaving Man Group’s website and entering a third-party website that is not controlled, maintained, or monitored by Man Group. Man Group is not responsible for the content or availability of the third-party website. By leaving Man Group’s website, you will be subject to the third-party website’s terms, policies and/or notices, including those related to privacy and security, as applicable.