Introduction
US High Yield (‘HY’) corporate bonds are often included in asset allocation models given their idiosyncratic return profile relative to other fixed income strategies. Historically, HY bonds have allowed investors to capture a credit risk premium that, while positively correlated with equity returns, provides a diversified return stream.1 Over the last 15 years, HY as an asset class has returned an annualized 6.9% per year, slightly lagging the 7.8% return of the S&P 500 Index, but with lower volatility than US Large Cap equities.2 These attributes make US HY an important part of asset allocation in our view.
One noticeable trait amongst US HY active managers (and most fixed income sub-asset classes for that matter) is the lack of quantitative investment offerings. We believe a new trend is emerging as systematic strategies begin to enter the field attempting to exploit human biases in investment processes, creating more potential diversification opportunities for investors.
Systematic HY Credit- Adding More Tools to the Asset Allocation Toolkit
Allocators recognize that market timing is a difficult task and that any one particular asset class will likely perform poorly at some stage of the market cycle. Combining multiple asset classes to build an optimal asset allocation mix, including combinations of complementary managers within asset classes, is common practice. Identifying a defined, repeatable process is one of the key metrics for institutional investors to build a well-diversified asset allocation mix.
One noticeable trait amongst most US HY active managers is the lack of quantitative investment solutions. We believe quantitative approaches may offer investment process diversification, potentially allowing allocators to further diversify portfolios with consistent and stable investment processes. Given the lack of systematic credit strategies currently in existence, it is difficult to point to data that highlights the diversification potential. However, we believe we can infer some conclusions from historical equity data. Using large cap equity strategies as a proxy, the 5-year correlation of monthly excess returns amongst quantitative and discretionary managers is 0.07.3 We believe this highlights the potential diversification power of utilizing both types of managers in an asset allocation mix and believe systematic fixed income strategies may offer similar diversification potential.
HY corporate bond returns have, in part, been driven by investors’ thirst for yield over the last several years given historically low interest rates. As a result, credit spreads went through a sustained period of tightening given the global backdrop. During these periods of relative calm, lurking under the surface is a potential set of idiosyncratic opportunities as average pairwise single-name correlations declined significantly since 2011 (Figure 1). These individual opportunities are born out of industry disruptions, technological advancements and company mismanagement, collectively forcing business model transitions and capital structure transformations. Fundamentally-based systematic techniques aim to identify and isolate these idiosyncratic opportunities in a risk-aware fashion.
Figure 1. Correlation of Underlying ICE BofAML HY Corporate Bond Constituents (3-year Rolling Using Monthly Returns)
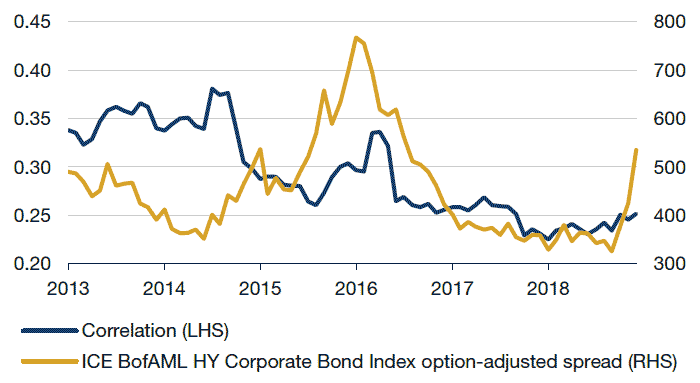
Source: Man Numeric and ICE BofAML.
Figure 2. Common Traits of Quantitative and Discretionary Managers
|
Quantitative |
Discretionary / Fundamental |
|
|---|---|---|
| Approach | Systematic, Disciplined | Judgmental, Situational |
| Portfolio Breadth | Broad | Focused |
| Value Added | Focus on exploiting dislocation from behavioral biases and optimal portfolio tradeoffs between risk, return, and transaction costs | Strength is deep dive analysis into security-specific special situations |
| Organizational Focus | Team, academic style | Star, pragmatic approach |
Source: Man Numeric. Please note: The above chart is solely the opinion of the author. We make no representation that this is indicative of the industry as a whole.
Investment managers have the potential to exhibit behavioral biases such as anchoring to positions or sectors of their knowledge base, demonstrating bias to recent events, and difficulty transitioning to different market environments. What will happen to active management returns as market regimes change? Will discretionary managers who have demonstrated success in a spread tightening environment be able to deliver in a changing regime? Systematic approaches attempt to minimize those behavioral biases to create a more consistent return profile. Furthermore, quantitative credit strategies can attempt to systematically exploit previously mentioned idiosyncratic dislocations, targeting a consistent alpha above a HY index. We believe that having a complementary approach in US HY may be beneficial and quantitative solutions could be a part of the discussion.
There is an obvious problem for allocators who wish to diversify their portfolios with quantitative investment processes: as the number of quantitative strategies in the equity market has continued to grow over the past decade, systematic strategies in fixed income remain relatively few and far between. Of the approximately USD1.3 trillion in HY assets, less than 0.5% reside in quantitative strategies.4 Yet, there is a rumbling afoot as recent entrants into the fixed income space from quantitative managers have begun to make headlines.5
So, What Has Changed?
What is driving increased interest from systematic investment firms to target alpha in the credit markets?
When evaluating the current opportunity for investment firms entering the quantitative fixed income landscape, it makes sense to look at the history of quantitative strategies within equities. Transaction cost modelling and systematic implementation of portfolio construction is often cited as a critical component to alpha generation for quantitative managers. HY corporate bonds have higher exposure to idiosyncratic returns, like equities, given where they sit in the capital structure of a firm and their linkage to the underlying businesses. It is only natural that quantitative equity firms, particularly those that focus on underlying company fundamentals, would gravitate towards the HY market.
Successful quantitative investors need certain key ingredients to have a recipe for success; breadth and liquidity of the universe top this list in our view. Equity markets have undergone an evolution on both of these fronts beginning in the 1990s as algorithmic trading programs and new execution venues have increased liquidity by linking buyers and sellers and reducing the frictional costs of trading. As a result, the average total cost of an equity trade in the US has fallen from approximately 53 basis points (‘bp’) in 2009 to less than 30 bp in the first quarter of 2018.6
Fixed income markets have yet to see as dramatic an evolution in market structure. Indeed, it remains to be seen if, and when, they will. What is clear is that electronic venues for execution within credit have provided a platform for such market structure changes to occur and have shown significant growth over many years. Although a hypothetical steady-state market share for electronic execution is unknown, the technical feasibility for algorithmic trading and movement of dealers into fully automated quoting may provide the next big leap forward in market structure and liquidity. It is our view that quantitative firms could be uniquely positioned to analyze the changing market structure of credit markets by cross-referencing collective experience born in algorithmic trading in equity markets.
Challenges of Generating Alpha in Credit
Systematic managers are constantly seeking to identify models that improve their forecasted returns, allowing for potential alpha generation. Given a positive correlation of equities and HY bonds, is alpha generation in HY as simple as porting intelligence from equity models over to fixed income? We do not believe it is quite that simple; in fact, we would argue that while a general investment philosophy targeting alpha in equities can be applied to HY corporate bonds, the underlying model inputs and signal construction must be tailored specifically for credit.
There are several credit specific nuances which must be accounted for when evaluating potential opportunities in high yield. As an example, the ICE BofAML US High Yield Index has roughly 1,900 securities (issues) and around 700 issuers. Simply focusing on company fundamentals, while ignoring the specific traits of each issue, could potentially lead to unforeseen risks. This is not something that asset managers generally have to deal with when evaluating equity investment opportunities.
Further, a lack of quality data and transparency in the corporate bond market has historically made it difficult to build a systematic fixed income portfolio. Today, data availability has increased, but the difficulty in extracting the data; maintaining a complex security, issuer and cross-asset class mapping; analyzing liquidity and transaction costs; and properly handling such a broad range of volatility of assets remains a challenge for investment firms considering quantitative credit strategies.
Evaluating Quantitative Systematic Credit Approaches
Given the structural differences of HY corporate bonds relative to equities, there are several factors for institutional investors to consider when evaluating the quantitative fixed income landscape:
- Data and how to handle it: Data is the foundation of all quantitative research processes. Handling the specifics of credit assets through collection of data and the resulting research process is critical to avoid survivorship and look-ahead biases. An example in HY credit is the challenge of properly handling mergers and acquisitions. The equity securities of M&A targets generally cease to exist once a deal is done, but the corporate bonds often persist. We believe that ensuring the research process avoids look-ahead bias is critical to making sure the given bonds map to the correct issuer through time.
- Target high yield or high quality? Much like equity managers can have philosophy biases towards value or growth-at-a-reasonable price, HY managers tend to focus on factors such as yield and quality. Can a systematic manager capture both? We believe that a well-balanced multi-factor approach targeting enhanced yield and higher quality securities in a peer relative framework provides an opportunity for alpha. Ultimately, bondholders look to receive both their principal and the coupon payments. Investors want exposure to bonds with the best combination of spread mispricing and favorable trends.
- Best metrics to determine if a high yield security is over or under valued? A cross-sectional, peer-relative view identifies potential candidates for investment. Credit ratings are known to be lagging indicators of risk, but is there still useful information in the ratings? Given how widely they are followed, our research indicates that there is and that combining ratings with additional risk factors followed by credit analysts and remaining systematic risk factors leads to better outcomes.
- Risk management: The challenge lies in incorporating a forward-looking view of factor and idiosyncratic drivers of returns that can also handle the dynamic nature of the credit market and respond to changing volatility regimes. Incorporating multiple levels of risk management through alpha modeling, explicit risk modeling, and through portfolio constraints is critical. Raw factors can produce significant backtest returns but often with very high volatility if various sources of risk are not accounted for.
- Portfolio construction: There may be benefits to being able to leverage time-tested portfolio optimization techniques from equities in fixed income. However, controlling for more practical risks in the credit markets such as jump to default, nuances around latent liquidity and odd lot size we perceive as equally as important.
- Trading expertise: Firms with access to in-house credit market trading expertise may help avoid adverse selection that firms without large credit trading operations may overlook. Balancing transaction costs and certainty of execution are key elements in our view.
HY credit trading may be a few steps away from fully algorithmic trading but in the future this could potentially create additional opportunity for systematic strategies, in our view. Systematic strategies allow HY investors to potentially improve the diversification of portfolios by eliminating behavioral biases found in discretionary approaches through rigorous research in identifying idiosyncratic alpha opportunities, risk modeling, transaction cost modeling and portfolio construction. The challenges and nuances are significant in terms of properly handling the data and accounting for the increased complexity of credit when compared with equities, but careful and thorough approaches could allow investors to optimize their asset allocation mix.
1. ICE BofAML High Yield Index correlation with S&P 500 Index for the 15-year period ending 31 December 2018 is 0.71.
2. US High Yield performance represented by the ICE BofAML High Yield Index. US Large Cap returns represented by the S&P 500 Index. Data is from 1 January 2004 to December 31, 2018. Past performance is not indicative of future results. Investment decision should not be made based upon this information.
3. Source: eVestment as of 30 September 2018. Represented by the US Large Cap Core universe. The managers in this data set do not represent the entire universe of US Large Cap managers.
4. HY assets: https://www.bloomberg.com/opinion/articles/2018-07-10/corporate-bonds-are-getting-junkier Quantitative HY assets: eVestment as of 30 September 2018. Represented by the US High Yield universe. The managers in this data set do not represent the entire universe of US High Yield managers.
5. https://www.economist.com/finance-and-economics/2018/08/11/factor-based-investing-spreads-from-stocks-to-bonds
6. Source: ITG.

You are now leaving Man Group’s website
You are leaving Man Group’s website and entering a third-party website that is not controlled, maintained, or monitored by Man Group. Man Group is not responsible for the content or availability of the third-party website. By leaving Man Group’s website, you will be subject to the third-party website’s terms, policies and/or notices, including those related to privacy and security, as applicable.