Introduction
High total returns. Diversifying. Relatively low risk. Infrequent drawdowns that are eminently tolerable when they do occur.
These are all characteristics that an investor may think of if asked to describe the perfect asset class. Low fees would likely be on the list too, but of course these attractive characteristics must come at a cost, leaving investors to consider how much of a premium they are willing to pay for this asset class versus others.
When it is revealed that the magical asset class offering these benefits is private equity (‘PE’), then the $1.43 trillion raised in PE funds over the past five calendar years1 indicates that a great many investors are clearly willing to pay premium fees for these characteristics.
On the surface, the allure of PE is entirely understandable. But what if the diversification, lack of deep drawdowns, and overall low risk profile of PE are at least somewhat illusory?
On the surface, the allure of PE2 is entirely understandable. But what if the diversification, lack of deep drawdowns, and overall low risk profile of PE are at least somewhat illusory? Furthermore, what if a substantial percentage of PE’s return is replicable via a significantly more cost-efficient substitute? If so, perhaps the real questions are 1) how much performance smoothing is really worth, and 2) whether PE should still command an outsized percentage of an investor’s total fee budget relative to the percentage of capital that is allocated to PE in that investor’s portfolio.
On the first question, the notion of an illiquidity premium exists to provide investors with a higher return than that of comparable listed assets in order to compensate for the greatly reduced liquidity and decreased flexibility to meet shorter-term liabilities, but it appears that many investors find smoothed returns so attractive that they are willing to pay a hefty fee premium and may even accept a return discount for them.
In this paper, we analyse each of these oft-cited benefits of PE and then examine the feasibility of generating performance that is similar to that of PE with a tailored portfolio of publicly traded companies. Taking into account our beliefs about the true risks of PE, we also explore whether “liquid private equity” strategies can play a similar role to traditional PE in investors’ portfolios.
Dissecting the Purported Benefits of Private Equity
Diversification
Those who believe that PE offers significant diversification benefits may point to the notion that owning private companies must be a diversifier to owning public companies because there should theoretically be no direct overlap between the two. True, putting aside public/private crossover portfolios and the public equities held in some traditional PE portfolios, investors should in theory not have overlap between their public equity and PE allocations. However, lack of direct overlap does not equate to lack of correlation.
There is a 75.7% correlation between the total returns of PE and the public equity market.
Indeed, there is a 75.7% correlation between the total returns of PE and the public equity market using the Cambridge Associates US Private Equity Buyout Index and the Russell 2500 Index3 as the proxies for private and public equity going back to the first quarter of 1997. In our view, this is a relatively high correlation, particularly in light of the fact that one asset class reports smoothed returns (i.e. marks asset values significantly less frequently) while the other does not.
Perhaps it should be completely intuitive that there is a meaningful positive correlation between public and private equity. After all, the PE industry uses public company comparables in valuing its portfolios (perhaps somewhat selectively throughout the market cycle) and, at a more fundamental level, both public and private companies are exposed to the same macroeconomic, industry-specific, and other top-down trends. Each company may have its respective drivers of revenue and ultimately economic performance, but they are still subject to dominant trends that pervade industries and that can impact almost the entire economy at times. Most of these macroeconomic and other top-down forces don’t distinguish between public and private companies. Furthermore, in our opinion most buyers of goods and services make their purchasing decisions with little regard for whether a company is publicly listed or privately held.
High correlations aside, we acknowledge that there is an argument often peddled by PE supporters that there are diversification benefits from accessing a greater breadth of private market opportunities. Many pro-PE analyses4 are quick to point out 1) the decline in the number of public companies during the first two decades of the 2000s, and 2) the meaningfully larger number of private companies than public companies.
On the first point, McKinsey has concluded that “reports of corporates’ demise have been greatly exaggerated” and that “concerns about the decline in the number of listed companies appear to be unfounded.”5 A key finding from McKinsey’s analysis is that the decline in the number of public companies is really an observation of what happened from 2000 to 2010, a period semi-bookended by two major market disruptions in the TMT Bubble and the Global Financial Crisis. Meanwhile, there was a rather negligible change in the number of publicly listed companies from 2010 to 2020 as the number of corporate exits was offset by the number of new entrants to the public market.
On the second point, it is true that there are far more private companies than public, but in our opinion that isn’t necessarily a concrete benefit for investors. We believe breadth of opportunity set is generally a positive, but greater breadth does not automatically mean a far greater number of investment-worthy opportunities. Intuitively, if the private universe was teeming with attractive, appropriately valued, investable companies, then 1) buyout funds probably would not need to turn to the public markets in volume in order to find attractive companies, as reflected in 2021 and 2022 being two of the years with the highest public-to-private takeout total deal values since 2007,6 and 2) we would not be witnessing an ever-rising level of dry powder in PE that has been repeatedly setting new all-time records almost every single year since 2013, including the all-time record level at which it is now perched (Figure 1).7
Figure 1. Buyout Dry Powder
Problems loading this infographic? - Please click here
Source: Preqin; as of 31 December 2022. Note that these are likely conservative numbers as they include only dedicated buyout funds, not capital earmarked for direct deals by large institutional investors or co-investments or other fund types.
The main point here, however, is the 75.7% correlation between PE and public equity.8 Perhaps Bryce Klempner said it best when he was a McKinsey partner focused on private markets and bluntly acknowledged that “uncorrelation was a myth to begin with”9 when discussing public and private equity.
Drawdowns
Higher correlations may not be the worst thing when times are good for both the private and public equity markets. What most investors want to avoid, rather, is both allocations being down significantly at the same time, i.e. exposed to the same left-tail risks. We find it hard to argue that the macroeconomic, geopolitical, or other top-down shocks that drive most left-tail outcomes (wars, Covid-19, massive inflation and the higher interest rates that are necessary to combat it, to name a few recent examples) are isolated to public companies in terms of their negative impact, but PE is able to sidestep these periods of significantly negative performance simply by smoothing their numbers via less frequent marking to market of their portfolio companies.
There is a philosophical argument to be had here, and even as a pro-public-equity voice in the debate we believe there is some merit in PE’s ‘patient’ approach to portfolio valuation. Just because one can value assets every day doesn’t mean one should. Perhaps public markets are too twitchy and can overreact at times (name one active public equity manager who has never seen a period of irrational pricing in the market!), in which case the patience exhibited by PE may be a more rational approach to assigning company valuations than relying on a sometimes fickle public market to do it for you. At the same time, these periods of irrational pricing in the short-term may present an opportunity for public equity investors to generate alpha by exploiting mispricings in the public markets day to day as security prices move beyond changes in the underlying fundamentals of companies. While PE managers miss out on this potential alpha-generating opportunity, they do benefit from not needing to react to these short-term, sometimes noise-driven mispricings in assigning valuations and can continue to reflect their long-term opinion of the value of a business based on its fundamentals, particularly when not actively seeking an exit.
This is a luxury for PE that public equity managers simply do not have at this time and it creates an uneven playing field in comparing the risks of private versus public equity, of which PE takes full advantage. If an investor can vastly reduce left-tail outcomes – or even just the appearance of them – they have the flexibility to incur greater risk in the form of increased leverage.10 Smoothing and the related appearance of substantially reduced left-tail risk allows PE funds to incur considerable leverage in their portfolio companies without showing much of the downside risk typically associated with high leverage.
The average company in a buyout portfolio tends to be small and highly levered, two of the characteristics that are typically most punished by public equity markets during downturns.
If portfolio valuation and reporting were allowed to be more consistent between private and public equity markets, investors might find that there is much less of a difference in drawdowns than is often believed. In practice, this may not be feasible because public market data are available daily and it is natural for investors to want updated data as frequently as possible.11 In an attempt to create what we believe is a much fairer comparison, we analyse the impact of marking Man Numeric’s internal database of liquid PE portfolio holdings to market only at the time of transactions, which still results in over 2,500 marks throughout the year on average. Even just this simple smoothing exercise results in a 55% reduction in downside capture compared with the standard process of marking all portfolio holdings to market every day.12
While this different approach to marking a public equity portfolio is an interesting thought exercise, it may be more concrete for someone who is trying to assess the true downside risk profile of PE to consider instead the characteristics of PE portfolio companies and how those characteristics are typically treated by investors during left-tail events and other periods of economic stress. In particular, the average company in a buyout portfolio tends to be small13 and highly levered, two of the characteristics that are typically most punished by public equity markets14 during downturns (Figure 2).
Figure 2. Payoffs to Different Stock and Company Characteristics in Significant Down Markets
Problems loading this infographic? - Please click here
Source: MSCI Barra, December 2022. Median top minus bottom quintile factor spreads for each factor during months that the Russell 2500 Index is down more than 5%, using Barra GEM LT risk model as the source of ‘generic’ factor payoffs. Value factor payoff calculated by Man Numeric using combination of Barra value factors: Earnings Yield, Book to Price, and Dividend Yield.
Given some of the key characteristics, or risk exposures, of many PE portfolio companies, we believe that PE’s ostensible lack of downside is at least a little misleading.18 We believe a number of the underlying risks that are punished by public equity investors during risk-off periods are also very present in PE portfolios, and this should not be ignored simply because PE’s marks are infrequent and less likely to exhibit a lot of downside.
We believe a number of the underlying risks that are punished by public equity investors during risk-off periods are also very present in PE portfolios.
PE proponents are also quick to note PE’s relative downside protection in each of the past three major market selloffs prior to 2022 – the TMT Bubble in the early 2000s, the 2008 Global Financial Crisis, and the initial Covid panic in early 2020. Putting aside the substantial benefits from smoothing, there have been other factors at play in each of these selloffs. The bursting of the TMT Bubble did not have as large an impact on PE’s returns as it might have if it occurred today given that that was a technology-led selloff and, according to our research, at the time PE had significantly less exposure to tech companies than it does now. PE’s sector weights were once again in favour during the Global Financial Crisis as we find buyout funds generally had large underweights in financials and real estate, two of the sectors hit hardest during that selloff.
The Covid-19 crisis was a bit different in that both the selloff and subsequent rebound were quick and extremely sharp in magnitude. The first quarter of 2020 featured a quick and violent selloff in public equities as pandemic-driven panic gripped the markets. The rebound that began in the final week of March 2020 was similarly sharp as the equity market rallied from its March nadir to finish the year firmly positive. Public equity managers naturally needed to mark to market daily and many showed a high level of volatility and downside risk during 2020, whereas PE managers had the luxury of stating the first quarter 2022 values of their portfolios months into the sharp rebound we saw for public comparables, after stimulative policy responses eliminated some of the direst potential outcomes for companies. By that time, PE did what we believe is the logical thing and did not mark their portfolio companies down as much as if they had been forced to mark them at the end of March 2022, for example.
Analysis of PE’s downside protection is made slightly trickier by the fact that some popular sources of historical PE index returns change over time. PE returns typically keep changing for many quarters after they are initially reported. Again using the Covid selloff as a recent example, when Cambridge Associates initially published its first-quarter 2020 US Buyout Index performance in mid-2020, the quarter was logged as -10.1% down. By the time of the fourth-quarter 2020 report, however, the first-quarter 2020 number had improved to -8.5% down.19 In other words, the illusion of downside protection in PE grew stronger as we became further removed from the actual crisis period. This is another fairly artificial luxury that public equities are not afforded as public equity index and portfolio returns are frozen once they are reported.
2009 was the last vintage of buyout funds to significantly outperform the passive public equity market, with every other year from 2006 to 2014 roughly in line with or underperforming the public market before unrealised gains are taken into account.
We have been in the midst of another selloff as we write this in 2022, and the trillion-dollar question is how much PE managers will mark down their portfolios given that this time their exposures are generally not well aligned with the areas of the market that have held up relatively better or those that have been more out of favour. Time will tell what the impact of the current market environment will be on PE performance, but for now it is interesting to note the degree to which PE’s reported numbers have been propped up by unrealised value for many years now, even following the extremely robust exit environment in 2021 (Figure 3). As Bain commented in its 2022 Global Private Equity Report, “if any asset in your portfolio was ready to sell, (2021) was the time to do it.”20 If General Partners (‘GPs’) missed that window, their true – perhaps unreported – performance could be taking a hit this year. Figure 4 shows that 2009 was the last vintage of buyout funds to significantly outperform the passive public equity market on a realised PME basis, with every other year from 2006 to 201421 roughly in line with or underperforming the public market before unrealised gains are taken into account, or even once they are in some instances. At the risk of stating the obvious, the magnitude of these unrealised gains may be on shaky footing given the market environment in 2022.
Figure 3. PE Exit Activity
Problems loading this infographic? - Please click here
Source: Pitchbook Q3 2022 “US PE Breakdown”
(https://pitchbook.com/news/reports/q3-2022-us-pe-breakdown). 2021 values are estimated.
Figure 4. Added Value of the LBO Market
Problems loading this infographic? - Please click here
Source: Man Numeric; as of June 2022. The chart depicts North American Buyout Kaplan-Schoar (‘K-S’) Public Markey Equivalent (‘PME’) using the S&P 500 Index, based on vintage aggregated quarterly cashflow data provided by Burgiss for North American equity buyout firms. 1994-2014 vintages calculated as of Q2 2022. PME calculated by Numeric using S&P 500 total return index. K-S PME has been the primary PME studied in the academic literature; see S. Kaplan and A. Schoar, 2005, “Private Equity Performance: Returns, Persistence, and Capital Flows”, Journal of Finance 60:1791–1823. Cashflow data is the highest-quality source of PE performance, in our view; this analysis compares the present value of distributions to contributions using a public index as a discount factor. No adjustment is made for liquidity risk; see M. Sorensen, N. Wang, J. Yang, “Valuing Private Equity”, The Review of Financial Studies / v27 n7, 2014 and M. Sorensen & R. Jagannathan, “The Public Market Equivalent and Private Equity Performance”, Financial Analyst Journal / v71 No 4, 2015.
We have poked many holes in PE’s purported downside protection here, but ultimately we firmly believe it’s highly unlikely that PE managers in aggregate consistently stock their portfolios full of companies that are immune to top-down shocks and the most difficult stretches within economic cycles. In fact, the general composition of PE portfolios may lead one to a very different conclusion – that PE portfolios are meaningfully riskier than their reported performance numbers would indicate.
Volatility
Helped immensely by smoothed numbers during downturns, PE’s reported returns are less volatile than those of most public equity portfolios and thus PE’s risk-adjusted returns may look quite attractive to many investors at first glance. It does not take a deep look beneath the surface, however, to see that smoothing artificially depresses the volatility of these reported numbers.
Once again turning to Man Numeric’s smoothing exercise, we observe a substantial decrease in volatility when we apply this approach of simply marking positions to market only at the time of transactions. This simple smoothing exercise decreases the portfolio’s volatility by 46%.22
In our view, smoothing unequivocally obfuscates the true underlying risk of PE portfolios.
In our view, smoothing unequivocally obfuscates the true underlying risk of PE portfolios, whether that is measured by volatility or return drawdowns. We do not believe that apples-to-oranges comparisons between PE and public equity justify paying a substantially higher fee for PE than for long-only public equity strategies. Nor should reports of the diversification that PE contributes to a portfolio. Acknowledging that all else equal many investors prefer to have smoothed returns reported to them,23 however, the question becomes how much of a fee premium should be paid for smoothing.
So What is the Appeal of Mimicking PE? In a Word, Performance
While there may be cracks in some of the foundational beliefs about PE’s value-add to a multi-asset portfolio, if it was a sham it frankly would not be worth anyone’s time to try to mimic PE. Regardless of how much leverage and other financial wizardry24 may be necessary for PE to manufacture its attractive returns, we acknowledge the historical performance of the asset class. At the same time, we recognise that as a highly levered long-only asset class a significant portion of this return is simple beta, which some academics estimate at well above 1 for PE, or even above 2 in some studies.25 Regardless of the exact number, we find it difficult to deny that there is a common beta that is shared by private and public equity and that is likely amplified by leverage. As discussed, the same macroeconomic and other top-down forces that impact public companies impact private companies. When wreaking havoc on companies’ input costs, inflation, for example, doesn’t distinguish between public companies’ and private companies’ supply chains.
This shared beta is the primary driver of the aforementioned 76% correlation between public equity and PE, but going beyond the broad beta exposure of PE, industry-specific headwinds and tailwinds impact the returns of both PE and public equity and they also tend not to discriminate between companies in the same industry based on the listing status of those companies. It is intuitive to us that companies in the senior-housing industry, for example, would benefit from the same demographic trends regardless of whether they are public or private. Likewise, changes in consumer spending levels should theoretically have a similar impact on public consumer-goods companies as they do on private consumer-goods companies. The list of examples goes on and on.
A liquid PE portfolio has shown the ability to generate greater ‘true’ alpha than US buyouts.
This is all a pointless thought exercise if it is too difficult for a public equity portfolio to generate a return that matches that of PE, or more specifically a return similar to PE’s that is generated by many of the same performance drivers as PE. But that is not the case. Perhaps top-tier buyout managers have something differentiated to offer, but multiple studies have found that PE returns can be generated by nuanced public market strategies using PE-like return drivers. For example, GPIF, the Japanese pension behemoth, found that “the long-term performance of a replicating portfolio… tracks closely with the Cambridge Associates Global PE Index (US Buyout).”26 A study out of Harvard Business School had a similar finding: “the passive replicating strategy represents an economically large improvement in risk- and liquidity-adjusted returns over direct allocations to private equity funds, which charge average fees of 6% per year.”27 Man Numeric conducted its own analysis and found that after beta-adjusting returns, a liquid PE portfolio has shown the ability to generate greater ‘true’ alpha than US buyouts (Figure 5).
Figure 5. Hypothetical Liquid PE Performance Comparison, January 2001 to September 2021
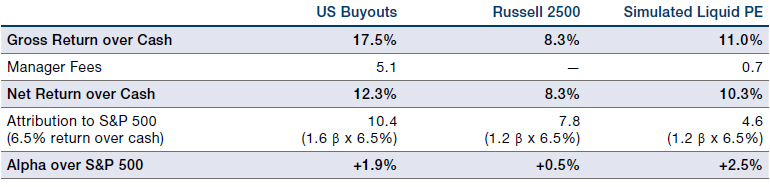
Source: Man Numeric; as of February 2023. The Simulated Liquid PE strategy uses a combination of qualitative and quantitative assessments to determine the appropriate investable universe and identify stocks that most closely resemble PE buyout characteristics and avoid those stocks and industries that PE firms typically do not invest in. US Buyouts Manager Fees assume 2% annual management fee, 8% hurdle rate, 20% performance slope, and ignore the impact of highwater-mark accounting; fees imputed from observed net-of-fee returns each quarter. US Buyouts Net Return over Cash derived from Cambridge Associates, US Buyout Index, as of 30 September 2021, based on quarterly, horizon-pooled returns net to limited partners. Please see the important information linked at the end of this document for additional information on simulated results.
Private Equity in Uncharted Territory – Why Liquid PE Should be Considered Now
It is possible that we have witnessed the end of historically cheap debt for this cycle, a critical component of buyout funds’ value proposition.
Now may be a particularly important time to consider liquid PE, even if just from a tactical standpoint, given that we believe the traditional PE industry is truly in uncharted territory. Perhaps the leading reason for the heightened vintage risk currently is that, in our view, purchase price multiples have been at all-time record highs. This is due in part to record-high dry powder levels that have marched steadily higher, setting new all-time records in seven of the past eight years, as noted previously. While these clear, multi-year trends are nothing new, a new variable has emerged more recently: inflation, and the sustained rise in interest rates that is expected as a result. Throughout much of its history, the PE industry has largely operated in a fairly benign interest-rate environment.
Rising interest rates impact return expectations for many asset classes, but we will take a narrower focus on just equity here. It is possible that we have witnessed the end of historically cheap debt for this cycle, a critical component of buyout funds’ value proposition, but there are other ways interest rates can impact portfolios. Traditional PE has significantly less exposure than the public equity market to some key industries that generally benefit from higher interest rates, like banks. At the same time, after years of pursuing software and other technology companies with a voracious appetite, we find that PE now has much more exposure to higher-growth, higher-multiple companies whose future cash flows are subject to a much higher discount rate in calculating a present value.
We believe the reality is that PE returns are often the result of simply riding the coattails of multiple expansion.
Regardless of the ultimate impact of higher discount rates,28 in our view it is more difficult to generate multiple expansion in a higher interest rate environment. While the hope of PE investors is that they are able to identify undervalued assets and then execute on a plan to unlock the value of those assets, we believe the reality is that PE returns are often the result of simply riding the coattails of multiple expansion. Bain finds that “multiple expansion has been by far the largest contributor to private equity buyout returns over the past decade, dwarfing revenue growth and margin improvement as sources of value creation” and its contribution has only been growing in recent years (Figure 6).29 In other words, many buyout funds have been able to post attractive returns without actually improving the operating performance of their companies. Bain went on to note that, in fact, “buyout investors on average have actually become less adept at improving the performance of their portfolio companies” as illustrated by the significant drops in revenue growth and EBITDA margin despite the healthy economic backdrop of the past few years (Figure 7).30 And, at the time of writing this paper, it doesn’t appear that things are going to get easier in the coming years.
Figure 6. Median Value Creation by Year of Exit
Problems loading this infographic? - Please click here
Source: CEPRES Market Intelligence; 2021 data as of 14 December 2021. Includes fully realised global buyout deals with more than $50 million in invested capital; excludes deals with missing data; excludes real estate and infrastructure deals.
Figure 7. PE Revenue and EBITDA Margins
Problems loading this infographic? - Please click here
Source: CEPRES Market Intelligence and Bain analysis; 2021 data as of 14 December 2021. Revenue shows median CAGR by year of exit. EBITDA margin shows estimated median CAGR by year of exit. Includes fully realised global buyout deals with more than $50 million in invested capital; excludes real estate and infrastructure deals.
For the many LPs that are wary of the current deal-making environment for PE, liquid PE could offer an alternative way to gain exposure to PE’s stated return drivers without getting locked into richly valued companies with increasingly more expensive debt and likely headwinds to multiple expansion, and thus diminished return expectations in the coming years versus the returns that have been realised historically. Those past performance numbers may have historically made it tolerable for LPs to look past the drawbacks to PE noted in this paper and pay meaningfully higher fees, but we believe the outlook is decidedly murkier for PE at this time.
Those Pesky PE Fees
True alpha that is difficult to replicate, which some top-tier PE managers appear to be able to provide consistently, should command a premium fee, but in our view much of the PE industry is awash in ‘alpha’ that is generated via effortless multiple expansion; utilisation of, ahem, ‘accounting loopholes’31; and other somewhat inorganic sources of return amplification like leverage that we believe should not command much of a fee premium at all. And one certainly should not pay dearly for simple beta and/or replicable alpha that can easily be found elsewhere for a much cheaper price.
Liquid PE may be worth considering as a significantly cheaper way to access many of the return drivers of top-tier PE managers.
Active managers in most other asset classes with clear, undeniable beta exposure are heavily scrutinised as investors seek to separate alpha and beta and endeavour to pay only for true alpha to the extent that is possible. Disentangling the two does not seem to be as popular in PE. We believe every PE manager should be put under the microscope to assess whether they are bringing about significant operational improvements or other business enhancements in order to justify their fees. In our opinion, financial engineering alone is not a good reason to continue paying PE’s stubbornly high fees. As weaker PE managers are exposed, liquid PE may be worth considering as a significantly cheaper way to access many of the return drivers of top-tier PE managers, perhaps even with less true risk.
This paper seeks to dispel some of the common perceptions that have driven PE’s pricing power, namely the belief that it is a diversifying asset class with low drawdown risk that offers high returns with relatively low total risk. Holes can be poked in each one of PE’s perceived benefits, but ultimately a large part of the reason for PE’s continued pricing power can be traced back to one of Porter’s Five Forces – there historically hadn’t been a sufficiently compelling substitute for PE, and many investors are still unaware that there is a more cost-efficient substitute now. If adopted more widely, liquid PE strategies that target the more nuanced beta or smart beta that traditional PE provides may even be able to give LPs more leverage in negotiating fees with traditional PE managers.
We do not need to look too far back in history for an appropriate analogy. Just a couple of decades ago, passive public equity market beta became easily accessible and a viable substitute for actively managed public equity portfolios, and began chipping away at the fees charged by active managers. As a result, many managers disappeared or saw their pricing power erode significantly. Many that could demonstrate their ability to add real value versus the passive alternative survived, however, and in a number of cases have thrived.
We believe we may be nearing that point with traditional PE. Surely there will be some PE managers that can demonstrate their added value beyond just levered beta exposure and continue to command attractive fees, but we have a hunch that many traditional PE managers would be unable to justify their current fees when their ‘alpha’ is truly scrutinised versus a more tailored benchmark. A thinning of the PE herd could be a good thing for the survivors as they face less competition for attractive deal targets and in theory could close deals at more favourable purchase price multiples, which in turn could generate better performance for LPs. But the big win for LPs could be gaining some leverage in their fee negotiations and performance-fee payments to PE managers.
The Role Liquid PE Can Play in an Investor’s Portfolio
If one believes that liquid PE strategies may be used as a fee-reducing tool or have potential as a way to ramp up PE allocations quickly, make tactical calls on vintage risk in traditional PE portfolios, and/or have a strategic place in an investor’s asset allocation, then it could be prudent to consider how this emerging option fits within one’s investment portfolio.
We believe there is simply too much shared beta between public and private equity to reasonably expect PE to be a true diversifier.
The simple correlation between PE and public equity – the 76% cited earlier – would seem to indicate that PE could indeed be grouped with public equity in a holistic equity allocation. The case for instead including PE in an Alternatives allocation is a bit weaker if a primary goal of one’s Alternatives bucket is to diversify versus the traditional public equity cornerstone of many asset-allocation plans. As detailed in this paper, we believe there is simply too much shared beta between public and private equity to reasonably expect PE to be a true diversifier. This is not a revolutionary thought by any means, as a number of institutional investors already combine PE and public equities in one allocation. Seth Kelly, the former CIO of US state public pension plans in both Pennsylvania and Missouri, stated that “we talk about public equity and we talk about private equity, and the only difference is public and private…They’re both equity, so when you’re thinking about it in a larger risk context, you’re thinking about equity.”32
At existing PE fee levels, however, this would result in an absolutely massive mismatch in the typical fees paid between investments within the same equity allocation. If one is simply looking to access many of PE’s key return drivers – and the outperformance of passive public equity markets that are expected to result – then liquid PE may be a more cost-efficient alternative. After all, it is difficult to justify paying substantially more for a highly correlated portfolio that may very well be riskier than the other portfolios with which it is correlated.
Turning our attention to the excess return correlation between traditional PE and liquid PE in order to strip out the impact of the shared beta that drives up their total return correlation, it would appear at first glance that PE and our liquid PE portfolio actually are diversifying to each other with a 14.9% correlation,33 and thus could be held together as complementary investments within the same asset class. At the same time, this might invite the question of whether liquid PE is achieving its goal of mimicking PE’s key return drivers.
If we strip out the impacts of PE’s smoothing and the substantial leverage it enabled, it becomes a lot more difficult to make an argument for why PE’s fees should be many multiples higher than that of liquid PE alternatives.
This analysis becomes quite interesting when we go one step further and examine the same excess return correlation but instead use the aforementioned smoothed returns of the liquid PE portfolio, which shows that the correlation between PE and liquid PE jumps to a rather high 87%.34 In our view, this analysis indicates that the key alpha drivers are actually quite similar between the two and it is really just PE’s smoothing that is creating the illusion of possible alpha diversification. Once smoothing is removed from the equation, there is much less difference between PE and liquid PE. Hopefully this has already become intuitive over the course of this paper, but we still find the magnitude of these empirics a bit startling.
Regardless of how investors approach their PE and public equity allocations, we firmly believe that liquid PE strategies can be valuable in multiple ways and for certain investors it may be in their best interest to at least consider them. Several potential use cases for liquid PE include:
- Cash management tool. Most institutional investors seek to minimise cash drag in their public equity portfolios. Many investors also pursue this public equity best practice in PE by investing committed capital that has not yet been called, but based on our conversations this is often done in fairly blunt fashion rather than investing committed PE capital in nuanced strategies designed to match the return drivers and key risk exposures of one’s PE portfolio. In addition, liquid PE can be a way to ramp up an increased PE allocation more quickly.
- Cost-efficient core in a core-satellite approach to PE. In this approach, liquid PE’s diversified exposure to popular PE industries and return drivers allows for satellites to be (i) high-conviction buyout funds that use expertise in a specific industry or other niche of the market to drive higher returns, and/or (ii) higher growth segments of broader private equity, like venture capital, that may be significantly narrower in their industry exposures. Investors that pursue direct investments and/or co-investment opportunities may also benefit from having a more diversified exposure at the core of their allocation that then allows them to absorb any potential concentration risk stemming from a smaller number of direct or co-investments.
- More nuanced PE benchmark. Liquid PE may be able to help LPs reduce the total fees paid to PE by identifying replicable sources of PE alpha and generating expected outperformance of standard public equity benchmarks, thus providing a more tailored benchmark on which to base performance-fee payments to PE.
Regardless of one’s views of liquid PE, if we strip out the impacts of PE’s smoothing and the substantial leverage enabled by that smoothing, it becomes a lot more difficult to make an argument for why PE’s fees should be many multiples higher than that of liquid PE alternatives, or public equity strategies more broadly for that matter. Simply marking companies’ valuations less frequently and reporting performance with a significant lag may be seen as a benefit by some Limited Partners (‘LPs’), but in our view it should surely not command a huge fee premium. If smoothing of returns is a, or the, leading benefit of PE – which it may very well be – then perhaps application of smoothing techniques could be explored in other asset classes or at least for liquid PE strategies that sit within a dedicated allocation to traditional PE.35 That is a topic for another discussion, but at the very least we believe that the perceived benefits of PE should be scrutinised more closely by investors and alternatives like liquid PE should be considered as a suitable alternative or a complement to a broader PE allocation.
1. Source: Data pack that accompanies PitchBook’s 3Q 2022 “US PE Breakdown” found at www.pitchbook.com/news/reports/q3-2022-us-pe-breakdown. Total PE capital raised in calendar years 2017-2021. Note that 2021 set a new calendar year record with $366.1 billion raised, and the $258.8 billion raised in the first three quarters of 2022 had the year on a pace not far off 2021’s record high. Buyouts have been easily the largest recipient.
2. While we use the term “private equity” somewhat loosely, this paper is focused on buyouts as representative of PE, not venture capital, growth equity, or other PE strategies that can play a different – and potentially important – role within the corporate value creation chain and may produce more idiosyncratic returns for investors.
3. Sources: Cambridge Associates, now via IHS Markit, and FTSE Russell for Russell 2500 Index. Simple return correlation using quarterly returns for indices noted from first quarter of 1997 (the first quarter currently available for the Cambridge Associates index) through the first quarter of 2022.
4. For example, “Should Defined Contribution Plans Include Private Equity Investments?”, Financial Analysts Journal, 18 July 2022.
5. https://www.mckinsey.com/capabilities/ strategy-and-corporate-finance/our-insights/reports-of-corporates-demise-have-been-greatly-exaggerated
6. Other than 2016, which was heavily influenced by the outlier $67 billion Dell-EMC deal. Source: Pitchbook Q3 2022 US PE Breakdown: www.pitchbook.com/news/reports/q3-2022-us-pe-breakdown. We acknowledge that the public-markets selloff in 2022 presented many opportunities for take-private deals, but 2021 was quite different in that regard.
7. Year-over-year increases in nine of the past 10 years, with the one exception being 2021, which with the benefit of hindsight was perhaps an inauspicious time to be drawing down capital and closing a flurry of deals ahead of a massive market slowdown and widespread downward resetting of valuations.
8. This correlation actually surpassed 90% as recently as mid-2020 on a rolling, trailing four-year basis, using four years to approximately match the latest median holding period of buyout companies.
9. https://www.institutionalinvestor.com/article/ b1kfbtq1j02js3/How-Private-Equity-Became-a-Beta-Play
10. At Man Group, we seek to do this very explicitly in some of our strategies focused on downside mitigation.
11. We recognise that many investors turn to liquid assets first when they need to withdraw capital and these assets need to have updated valuations at that time, much like the situation with the UK gilts market in September-October 2022. This example happened during a period of market stress, but unfortunately there is no option to avoid marking portfolios of public securities simply because one expects the assets to rebound eventually. PE, however, can do exactly that.
12. Source: Man Numeric. Analysis uses full quarterly returns of live versus simulated smoothed portfolio from 1 July 2018 through 30 September 2022.
13. Source: Man Numeric, December 2022. The average size of companies in buyout funds just passed $1 billion USD during 2021. For comparison, the small-cap Russell 2000 Index has a median market capitalisation of $1.03 billion USD as of 31 October 2022.
14. We acknowledge that there are other payoffs shown in Figure 2 that are favourable to PE, notably more profitable companies being in favour as well as lower risk, more predictable, less cyclical companies.
15. There are various ways to measure this, but the Financial Times notes a debt/EBITDA ratio of PE deals that is approximately double that of equivalent public companies in its September 2021 article “Private Equity is Leveraged Equity” (www.ft.com/content/375306e7-0d64-4bea-a75f-e8a500facf1d).
16. Using both 1) sector-neutral Barra model spreads and 2) allowing for sector-driven influences.
17. Source: Empirical Research Partners, Debtors’ Prison Part III: Rising Rates and the Debt Burden of Corporate America, 27 April 2022. As noted by Empirical Research Partners, only about 15% of outstanding debt for large companies is rate sensitive, but for a fairer comparison with PE the focus should be on small companies. Approximately 30% of public small-caps’ outstanding debt is rate sensitive, a figure that is dwarfed by the 70% of debt tied to PE-linked firms that is rate-sensitive.
18. One glaring example (albeit less headline-grabbing than the sudden collapse of the cryptocurrency exchange FTX in October 2022, for example) of a misleading lack of markdowns is Southland Royalty, at one point a PE-owned energy company, which went bankrupt only 83 working days after being marked by its PE owner, EnCap, at 99% of its invested equity. As noted in the Financial Times article “Private Equity and the Mark-to-Market Myth” (www.ft.com/content/ a09f0885-f15a-4ad3-b4ae-3bc9f2bc5430).
19. Source: Cambridge Associates, December 2022. Note that this first-quarter 2020 return steadily declined again in subsequent reports.
20. Source: Bain & Company, Global Private Equity Report 2022 (https://www.bain.com/insights/topics/global-private-equity-report/).
21. We ran this analysis using 2014 as the latest vintage year in order to give PE portfolios sufficient time to mature. Only time will tell what more recent vintages ultimately yield for investors, but it is generally true that more recent vintages have more exposure to investments made at higher purchase price multiples and that their reported portfolio values have larger percentages that are in unrealised gains.
22. Source: Man Numeric. Analysis uses full quarterly returns of live versus simulated smoothed portfolio from 1 July 2018 through 30 September 2022.
23. As posited in “Catering and Return Manipulation in Private Equity,” 18 October 2022 (https://papers.ssrn.com/sol3/papers.cfm?abstract_id=4244467), which was reported on by Hannah Zhang of Institutional Investor, who cited the report’s authors’ view that “Some PE fund managers manipulate interim returns in a manner consistent with their investors’ desires.” Source: Institutional Investor, “How Allocators are Complicit in the Manipulation of PE Returns,” 27 October 2022 (https://www.institutionalinvestor.com/article/ b20dnrl3lcx078/How-Allocators-Are-Complicit-in-the-Manipulation-of-PE-Returns).
24. Such as subscription lines and other methods of amplifying PE’s returns somewhat artificially.
25. Source: A. Coupe, “Assessing Risk of Private Equity: What’s the Proxy?,” CAIA Member Contribution, Q3 2016. Also, keep in mind the significant negative payoff to the higher beta factor during down markets, as shown in Figure 2.
26. Source: GPIF, “Alternative Asset Replication Using Exchange-Traded Assets”, March 2021 (www.gpif.go.jp/en/investment/Alt_rep_report_en.pdf)
27. Source: “Replicating Private Equity with Value Investing, Homemade Leverage, and Hold-to-Maturity Accounting” by Erik Stafford, Harvard Business School, 2015 (https://www.hbs.edu/ris/ Publication%20Files/ReplicatingPE_201512_3859877f-bd53-4d3e-99aa-6daec2a3a2d3.pdf)
28. Acknowledging that there are investors who believe the impact of interest rates on the valuation of high-growth companies is overstated.
29. Source: Bain & Company, Global Private Equity Report 2022.
30. Source: Bain & Company, Global Private Equity Report 2022.
31. Such as subscription lines (which are not discussed in this paper) and healthy interest deductions, to name two examples besides smoothing.
32. https://www.buyoutsinsider.com/pennsylvania-state-employees-pension-reduces-pe-target-and-redirects-to-microcap-stocks/
33. Source: Cambridge Associates, Man Numeric, December 2022. Excess return correlation between Man Numeric’s liquid PE database and Cambridge Associates US Buyout Index returns, both using the Russell 2500 Index as the benchmark.
34. Source: Cambridge Associates, Man Numeric, December 2022. Using same excess return calculation but replacing standard liquid PE returns with aforementioned smoothed liquid PE returns.
35. In other words, include liquid PE in the PE allocation and make all investments in that bucket consistent in terms of marking and reporting frequency.
You are now leaving Man Group’s website
You are leaving Man Group’s website and entering a third-party website that is not controlled, maintained, or monitored by Man Group. Man Group is not responsible for the content or availability of the third-party website. By leaving Man Group’s website, you will be subject to the third-party website’s terms, policies and/or notices, including those related to privacy and security, as applicable.