Introduction
According to the efficient-markets hypothesis, momentum shouldn’t exist as an investment style. Yet the academic studies and data suggest otherwise.
Don’t take it from us – take it from one of the best-known proponents of the efficient-market hypothesis:
“The premier anomaly is momentum”
- Eugene Fama (2013 co-recipient of the Nobel prize in economics)1
Momentum is exploited by investors in two main styles: time series and cross-sectional. In November, both styles were hit hard. Not for the first time, and probably not the last.
Before we get into what happened and why, let’s start with the basics.
What is Momentum? Time Series vs Cross Sectional
In physics, the more momentum an object has, the harder it is to stop. It will continue moving in a given direction unless acted upon by an external force.
Prices that are increasing tend to continue to go higher, and those that are decreasing tend to continue to fall.
A similar phenomenon is observed in asset prices; prices that are increasing tend to continue to go higher, and those that are decreasing tend to continue to fall (i.e. asset prices seem to exhibit momentum). This effect appears to work on stocks, bonds, commodities, currencies, and even crypto.
The simplest way of potentially profiting from this phenomenon, then, is to buy assets that have positive momentum and short those with negative momentum. Hey presto – we have a trading strategy taking time-series momentum. We look back at the price movements of lots of markets to build buy and sell signals, then size our positions according to the strength of those signals. This is what trend-following managers do, across many markets – mainly in liquid futures where positions can be easily adjusted and trading on margin facilitates leverage. Positions can be large, and directional – so in our view it’s a good idea to scale the size of positions in accordance to how risky (volatile) they are.
Where time-series momentum involves taking directional positions, cross-sectional momentum is a market-neutral approach. A time-series strategy will take a position in an S&P 500 future (for example) based on the price movements of the index as a whole, but what if we look a little deeper at the underlying stocks? Let’s pick a time period to measure performance over, rank the returns of every stock in the S&P 500 over that period, then go long the top-ranked stocks and short the lowest-ranked ones. We now care not about the absolute performance of the index, but the relative performance of stocks within it. Even if the entire index fell along with every stock in it, we can still be profitable if our short positions have done relatively better than the longs.
So, we’ve established what time-series and cross-sectional momentum are. We know that trend-following strategies employ time-series momentum (quite successfully in 2022 too2). The exposures here are multi-asset and directional.
But who employs cross-sectional momentum? Well, statistical-arbitrage strategies often deliberately take cross-sectional momentum risk – but it is surprisingly common to see it also in traditional equity long/short strategies, and not always deliberately. Wherever we have a portfolio of long vs short stocks, there is the possibility for some cross-sectional momentum risk appearing. This risk is often referred to as the “momentum factor”. It is something to look out for when analysing equity long/ short portfolios.
What was the Situation Coming into November?
We’ve seen some strong trends in 2022, which is to say that there have been some strong time-series momentum signals.
Figure 1 shows some time-series momentum signals for a simple (theoretical) strategy. We use this very simple model (purely built off moving-average prices) to indicate what signals may look like; it does not reflect a live strategy.
Figure 1. Indicative Trend Signals
Problems loading this infographic? - Please click here
Source: Man FRM; as of 5 December 2022. The example shown is a hypothetical illustration; please see important information at the end of this document regarding hypotheticals.
We can see that coming into November, the signals told managers to be very short equities (S&P 500 and NASDAQ), short bonds (US 10 Year), and short currencies (EUR and GBP vs long USD).
In the cross-sectional momentum space, Figure 2 from Morgan Stanley nicely illustrates a sector-based view of its US momentum basket, comprised of a notional pair trade that is long high-momentum stocks and short low-momentum names, rebalanced daily.
Figure 2. Morgan Stanley 12-Month Momentum Basket: Net Overweight/Underweight Sectors
Problems loading this infographic? - Please click here
Source: Morgan Stanley Thematic Strategy; as of 1 December 2022.
If we step back and consider the positioning in both styles of momentum, we can see that there is an underlying theme to the positions in both – inflation.
On the long side of cross-sectional momentum, we have energy and defensive stocks. On the short side we have technology, communications and consumer discretionary.
If we step back and consider the positioning in both styles of momentum, we can see that there is an underlying theme to the positions in both – inflation.
High inflation comes with higher commodity prices, higher interest rates, and the possibility of a recession. Hence the positioning we see in time-series strategies, and their good performance in 2022. At the stock level, those same inflationary effects have helped energy and defensive stocks relative to technology and discretionary ones, hence the positioning we see in the Morgan Stanley basket.
I think we can see where this is going.
What Happened to Momentum in November?
In short, the most-watched inflation datapoint in the world surprised markets. The US CPI print came in below the consensus forecast. This is good news (although perhaps not as euphoric as the initial market reaction would suggest).
However, remember that both our flavours of momentum have been positioned for inflation – exactly the wrong way round for this news. The reaction was not pretty.
Figure 3 shows the Morgan Stanley US Momentum Custom Index, comprised of a notional pair trade that is long high-momentum stocks and short low-momentum names, rebalanced daily. This proxy for cross-sectional momentum suffered an intramonth drawdown of 17%, one of its worst periods over the past year, before bouncing a little.
It is interesting to note that the hedge-fund rumour mill suggests that this “momentum unwind” has led to some significant deleveraging of equity hedge funds, causing ripples to managers that don’t directly trade cross-sectional momentum.
Figure 3. Cross-Sectional Momentum – Morgan Stanley US Momentum Custom Index, Price Level
Problems loading this infographic? - Please click here
Source: Bloomberg; as of 31 November 2022.
Being short stocks and short bonds now seems to increase risks rather than diversify them away.
Figure 4 portrays the SG Trend Index, which tracks 10 equally weighted large trend-following funds and is a convenient barometer of time-series momentum. This index didn’t drop quite as much as cross-sectional momentum, but losing more than 6% still put it on course for its worst month since February 2018 (when a short volatility exchange-traded product with almost $2 billion of assets collapsed3). It is notable that until relatively recently, trend managers could reasonably have expected equities and fixed income to have been negatively correlated; being short stocks and short bonds now seems to increase risks rather than diversify them away.
Figure 4. Time-series Momentum – SG Trend Index, Monthly Returns December 2002 – November 2022
Problems loading this infographic? - Please click here
Source: Bloomberg; as of 1 December 2022.
Was This Co-Incident Loss in Both Styles of Momentum a One Off?
While there is no theoretical reason why both takes on momentum should struggle at the same time – not least because time-series momentum is multi-asset while cross-sectional momentum is just equities – history suggests that their performance has tended to coincide. Figure 5 depicts a modestly positive correlation between cross-sectional and time-series momentum over the long term.
Figure 5. Rolling 12-month Correlation Between SG Trend Index and Barra US Momentum
Problems loading this infographic? - Please click here
Source: Man FRM and Bloomberg; as of 17 November 2022. The periods highlighted are exceptional and the results do not reflect typical performance. The start and end dates of such events are subjective and different sources may suggest different date ranges, leading to different performance figures.
The recent spike in the correlation is sharper than seen in the past, but reflects the two momentum styles’ habit of acting in concert in the tails of the distribution curve. Figure 6 charts this relationship between tail events (when either cross-sectional or time-series momentum moved by more than two standard deviations) and their positive co-movement (the percentage of tail moves in each year when cross-sectional and time-series momentum moved in the same direction).
Figure 6. Co-movements in Momentum Tails, Returns Normalised by Rolling One-Year Standard Deviation
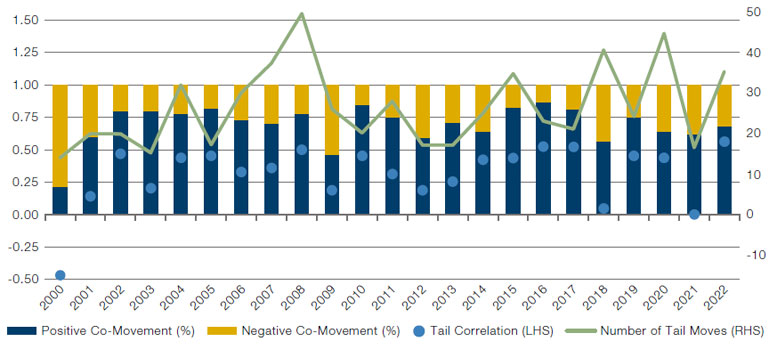
Source: AHL and Martin Luk; as of 24 November 2022. The periods highlighted are exceptional and the results do not reflect typical performance. The start and end dates of such events are subjective and different sources may suggest different date ranges, leading to different performance figures.
Both momentums have often sold off at the same time.
These coincident tails, signifying that both momentums have often sold off at the same time, is a problem for any investor holding both in the expectation of diversified crisis alpha. Our past research meant we did not expect any such diversification across time-series and cross-sectional momentum, which was reinforced by the evidence from November.
How Does Man FRM Measure Momentum Risk?
The first port of call when examining cross-sectional momentum is to look at momentum factor exposures, produced by our risk models. This gives a good indication of the directionality of the risk (long or short momentum), its evolution over time, and which managers to focus on.
However, factor exposures won’t tell us the size of time-series momentum risk, or easily translate into a quantification of profit and loss (P&L) impact should momentum reverse. Therefore, we developed “reversal stress tests” which take the prices of every asset in a portfolio, and then move them back to where they were at some point in the past (10 days, 20 days, or 60 days ago) and calculate the P&L impact.
Figure 7 shows us the 20-day reversal stress test results, over time, for a time-series strategy. A negative number indicates a P&L loss when all asset prices are moved back to where they were 20 days ago. Hence, a large negative number is an indication of greater momentum risk and is a concern, as we see in the chart for October 2022. At these moments, potential courses of action for us could be to bear the risk, to reduce the allocation to the strategy, or to hedge the risk out. The fact that the chart shows a very large positive spike in November 2022 indicates we’ve just been through a sharp momentum reversal.
Figure 7. Example Reversal Stress Test Results for a Time-Series Momentum Strategy
Problems loading this infographic? - Please click here
Source: Man FRM; as of 2 December 2022. The periods highlighted are exceptional and the results do not reflect typical performance. The start and end dates of such events are subjective and different sources may suggest different date ranges, leading to different performance figures. The example shown is a hypothetical illustration; please see important information at the end of this document regarding hypotheticals.
Conclusion
There are many defensive and positive risk-management properties built into the best time-series programmes and they tend to shine in prolonged crisis periods.
Overall, we still like momentum strategies – time series in particular. There are many defensive and positive risk-management properties built into the best time-series programmes and they tend to shine in prolonged crisis periods. Cross-sectional momentum too has a place in portfolios, in our view, but we must be careful as it can quietly creep into equity portfolios unintentionally. Finally, we must be aware that inversions in momentum are likely to be painful for both styles of momentum at the same time.
With contribution from Erlind Tusha.
1. Fama, Eugene F., and Kenneth R. French. “Dissecting Anomalies.” The Journal of Finance, vol. 63, no. 4, 2008, pp. 1653–78.
2. For more analysis of the performance of time-series momentum during 2022, you can watch this recent webcast or read the transcript provided.
3. Source: Financial Times, 6 February 2018.
You are now leaving Man Group’s website
You are leaving Man Group’s website and entering a third-party website that is not controlled, maintained, or monitored by Man Group. Man Group is not responsible for the content or availability of the third-party website. By leaving Man Group’s website, you will be subject to the third-party website’s terms, policies and/or notices, including those related to privacy and security, as applicable.