Introduction
Inflation and interest rates are continuing to dominate the conversation in asset markets. Much of the attention for the last year has been on the speed of the slowdown in inflation and what that might mean for central bank policy and the longer-term cost of capital. An area we believe the market is less focused on is the cumulative change in the price level since the end of 2019 and the impact that will have on corporate earnings. For example, in both the UK and US, there has been a cumulative increase of approximately 20% in the nominal price index since the end of 2019 alone.
Combined with the gentle continuation of real global GDP growth, this has led to a 26% increase in nominal UK GDP since the end of 2019 and a greater than 30% increase in nominal US GDP over the same period. In this paper, we will begin by explaining the short-term implications of inflationary periods, before focusing on the longer-term impact on corporate earnings power that we believe has hidden a volume recession in several cyclical markets. This is where we believe opportunity may lie.
Figure 1. UK & US Nominal GDP
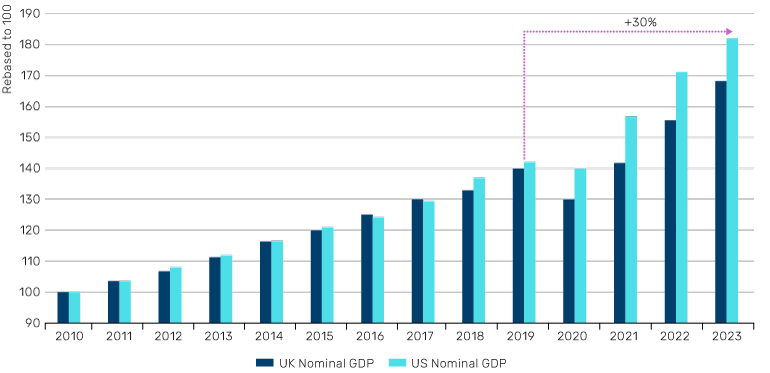
Source: Bloomberg. Data as at 31 December 2023.
Short-term implications of inflation
In the short term, inflationary periods can lead to certain companies over- or under-earning. The driver of this short-term impact on profitability depends on various factors such as the incidence of inflation (does it impact revenue or cost?), pricing power, asset turn and contractual structures. In most cases it leads to higher revenue for all businesses as inflation works through the income statement, but absolute profitability and margins can be impacted positively or negatively. These impacts, while often short term in nature, can influence profitability for several years and typically manifest themselves through higher (over-earning) or lower (under-earning) margins versus history.
Next we show two worked examples of UK companies which have been beneficiaries and dis-beneficiaries of a higher inflationary environment. The first is a UK Waste Management company which benefitted significantly from inflation over the past few years. During 2020, the company saw an increase in the value of recyclate pricing (a significant revenue component) – higher commodity prices and wider inflation caused some plastic recyclate prices to rise over 30%, paper nearly 50% and metals almost double.
Figure 2. Global Recyclate Index
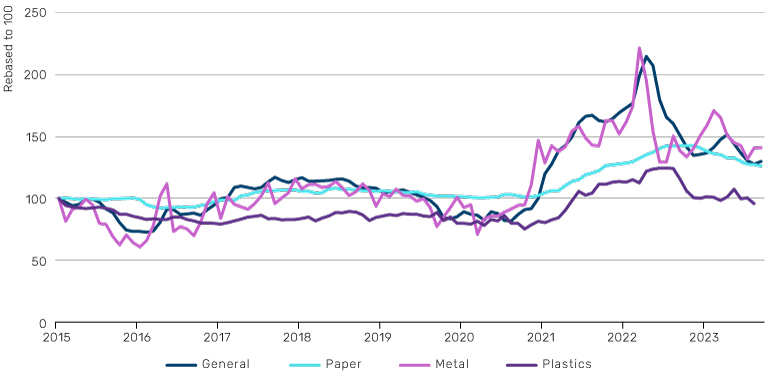
Source: Bloomberg. Data as at 31 December 2023.
This provided a boost in revenue in 2021 and 2022, which given the relatively high fixed cost base and low margin structure of the business, led to a significant jump in earnings and margins. It started to over-earn in the short term.
Figure 3. UK Waste Management Company Over-Earning
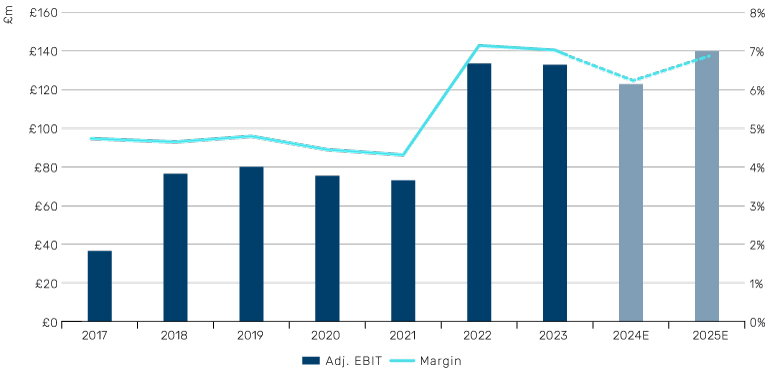
Source: Bloomberg, Company Accounts.1 Data as at 31 December 2023.
By contrast, a UK Food Producer saw material food price inflation in the UK during 2020 and 2021 driving up their cost of goods sold.
This was partly recovered through higher revenue, but given the poor pricing power of the business, the relative power of their customers (large supermarkets) and the slow contractual nature of the pass through of higher costs, earnings and margins came under significant pressure. This business began under-earning.
Figure 4. UK Food Producer Under-Earning
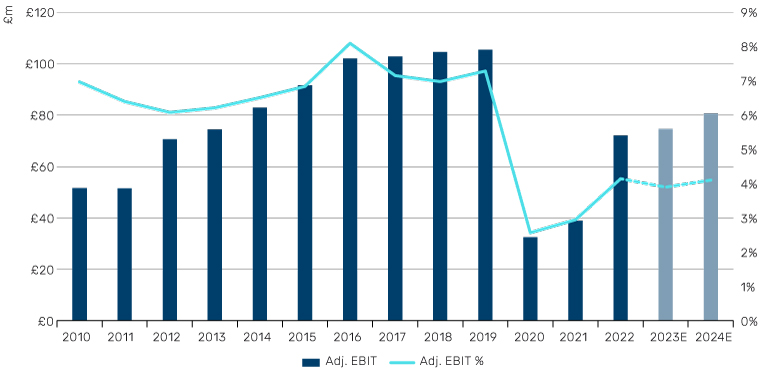
Source: Bloomberg, Company Accounts. Data as at 31 December 2023.
These factors typically normalise over the medium term – contracts roll off and are repriced, high returns are competed away through incremental capital flow and increased supply, or demand simply moves elsewhere. We believe there are opportunities to generate alpha by taking both short and long positions in companies as they work through these short-term cycles.
Importantly, we believe the framework for the short-term impacts of inflation on profitability are increasingly well understood. Instead, we wanted to focus on an area we believe is much less discussed; the medium-term impact of inflation on corporate profitability and then highlight the areas of the UK which we believe are materially mispriced as a result.
High nominal growth recessions
There is a difference between high nominal GDP growth recessions and low nominal GDP growth recessions. The Pavlovian reaction of recent times (i.e. 2001, 2007 and 2020) is that any recession has a material negative impact on corporate earnings, but we believe that is only because the most recent incidents were all low nominal growth recessions. During high nominal growth recessions (i.e. 1973), the impact on earnings tends to be much more limited and instead the derating of equities is the more powerful driver of share prices. Corporate earnings are ultimately a function of nominal GDP and hence it is hard for aggregate profitability to fall materially during a period of significant inflation. This gets to the nub of what we believe the market is currently underestimating; we expect corporate earnings to prove far more resilient, in stark contrast to the pervasive bearish narrative. That is certainly playing out so far. While the US economy has not yet technically entered a recession, the current slowdown in real economic activity has certainly been felt by many businesses in both the US and UK and provides analogies to other high nominal growth recessionary periods.
Over the medium- to long-term, revenue, profit, and cash flow produced by companies in aggregate typically normalises to grow in line with nominal GDP. As a result, UK corporate earnings as a percentage of nominal GDP has been broadly stable at 22% since the 1960s and this relationship holds for other developed global markets too. Since 1960, corporate profits in the UK have increased by 7.4% per annum and nominal GDP has grown by 7.5%.
Figure 5. UK Corporate Profits vs. UK Nominal GDP
Problems loading this infographic? - Please click here
Source: Bloomberg. Data as at 31 December 2023.
This is why equities have been able to offer a positive real return over long periods and act as an inflationary hedge. As the graph below shows, US equities have offered nearly a 9% annual real return over the past 40 years, while UK equities have offered over 7%. We are not trying to make the case for the long-term attractiveness of equity markets per se. We are simply reiterating the point that corporate earnings are nominal in nature and buoyed by inflationary periods.
Figure 6. Equity Market Real Return
Problems loading this infographic? - Please click here
Source: Bloomberg. Data as at 31 December 2023.
Where has it already happened?
There are already many examples of where absolute corporate profitability has risen with nominal GDP. These are not companies that are over-earning (in the short-term sense described above) but have simply seen revenue and profit rise with nominal GDP growth over the past three or four years. These are businesses that have only benefitted from limited cumulative volume growth, have margins in line with history but simply are earning higher nominal profits because of higher nominal GDP.
For example, a UK Catering Company has seen volumes recover to only 95% of their 2019 levels given the continued impact of working from home and the loss of several office sites. We mention this to disaggregate volume and price and show that the growth in revenue and profitability we discuss below is not simply because the business itself has grown or taken market share.
Figure 7. UK Catering Company Volumes
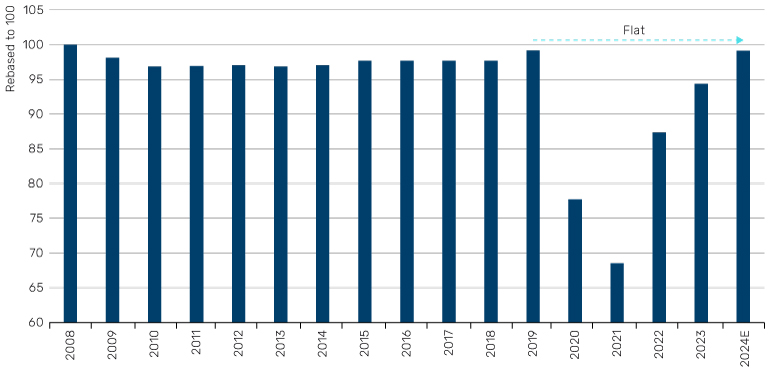
Source: Bloomberg, Company Accounts. Data as at 31 December 2023.
Despite broadly flat or negative volume growth, revenue is now 27% larger than it was in 2019 – broadly mirroring the growth in global nominal GDP over that period.
Figure 8. UK Catering Company Revenue
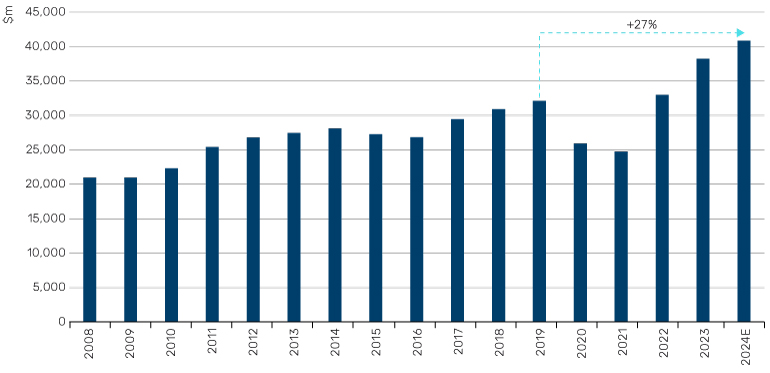
Source: Bloomberg, Company Accounts. Data as at 31 December 2023.
Over the same period, absolute profit is also nearly 21% higher than in 2019, despite lower volumes. The chart below shows that the business is not over-earning (as per the framework described above), with margins only back or even still slightly below their pre-2019 levels. This company is a microcosm of what we believe is likely to happen across the market; that corporate earnings mirror the growth in nominal GDP and thus are likely to be much higher over the medium term.
Figure 9. UK Catering Company Profit
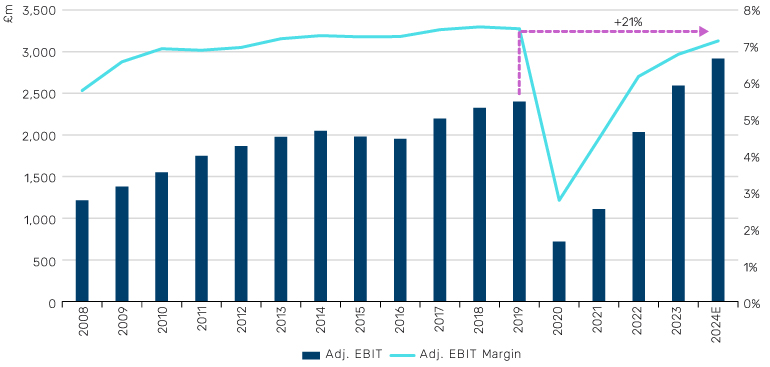
Source: Bloomberg, Company Accounts. Data as at 31 December 2023.
This growth in absolute profitability has not gone unnoticed by the equity market, with the shares making new all-time highs in 2023. Again, this is logically consistent with the idea that corporate earnings grow with nominal GDP, equity values grow with nominal earnings and hence equities have historically generally kept pace with, or beat, inflation. Given the significant rise in nominal GDP, it is likely that most companies will make significantly higher earnings than they did before this inflationary episode.
Where might it happen next?
Excitingly, we think there are several parts of the UK market where this dynamic is being misunderstood. There has been considerable concern about an impending earnings crisis within cyclical sectors for over a year now – the market is waiting for (and pricing in) profits at these companies to fall materially. What we believe the market is missing is that the ‘volume recession’ at these companies has already happened. It is already tough out there for these businesses – volumes are down materially, end markets are destocking, lower fixed cost absorption and negative operational gearing have already started to bite – but these pressures have been ‘covered up’ or ‘hidden’ by the impact of nominal GDP growth. We will explore three stock examples below 1) a global Steel Refractory Business, 2) a Staffing Company and 3) a UK Brick Manufacturer.
Let’s start with the UK listed Steel Refractory Business. There has been a significant cyclical slowdown in end markets over the past 18 months – global steel production volumes are forecast to be the worst on record in 20 years (excluding 2009), European countries are considering state support to keep some producers going, there has been an end market destocking, and the company has under-produced relative to sales. Volumes in 2023 and 2024 are expected to be 16% below 2019 levels. It’s already bad out there, there has already been a volume recession.
Figure 10. WSA Global Ex-China Steel Volumes
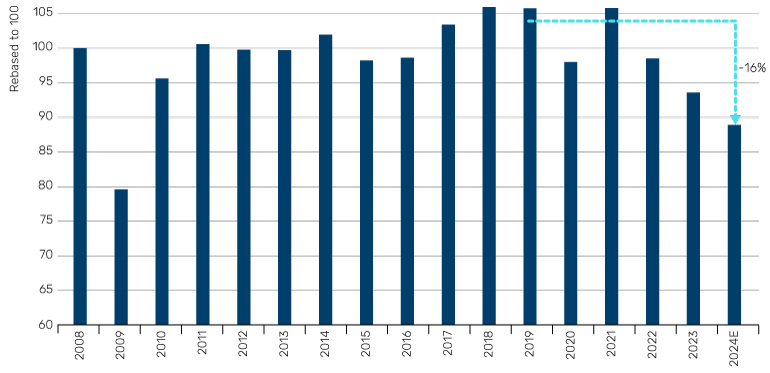
Source: WSA, available here: https://worldsteel.org/media/press-releases/2024/december-2023-crude-steel-production-and-2023-global-totals/, Bloomberg. Data as at 31 December 2023.
Revenue by contrast is 13% higher than in 2019, as inflation across the cost base has been passed through to customers. This business has seen material increases in energy costs, certain raw materials and most importantly labour – all of which have been broadly recouped through higher pricing. Despite volumes likely 16% below 2019 levels, the impact on revenue has been much less dramatic – it has even been positive! – given inflation and the rise in the nominal price level.
Figure 11. Steel Refractory Business Revenue
Source: Bloomberg, Company Accounts. Data as at 31 December 2023.
Over the same period, the impact on profit is likely similar, around 10% growth since 2019, with broadly stable margins. The market is fearful that earnings ‘haven’t cracked yet’ and given the UK economy slipped into technical recession at the end of 2023 – isn’t that inevitable? Isn’t that rightly why the market is valuing these businesses towards record low EV/sales and sub 10x earnings? We think not. On the contrary, the recession in volumes for this business has already happened and the impact on earnings has been hidden by the impact of nominal GDP growth.
Figure 12. Steel Refractory Business Profit
Source: Bloomberg, Company Accounts. Data as at 31 December 2023.
As volumes recover in this business over the rest of 2024 and 2025, we believe they will make 20-30% more profit than they did in the past. Analysts and investors are wrongly anchoring to 2019 as a base from which earnings might fall, rather than a base from which they will likely grow. This business is priced for an impending earnings collapse, not a cyclical trough. We are not asking for anything unique to happen here – it is already happening in many other parts of the UK market – see for example the Catering Business above.
Figure 13. Steel Refractory Business Blended Forward PE
Problems loading this infographic? - Please click here
Source: Bloomberg. Data as at 31 December 2023.
Similarly, take a UK listed but global Staffing Company. A slowdown in confidence has led to a fall in permanent candidate placement volumes that has only been eclipsed once in the last 25 years, during the Global Financial Crisis (GFC).
Figure 14. European Recruitment Market Volumes
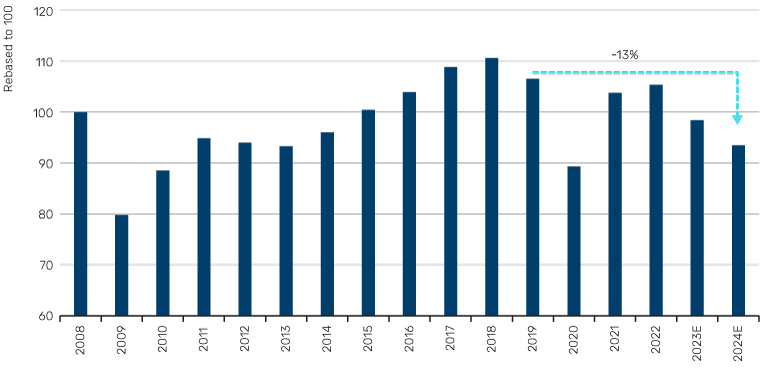
Chart shows a country weighted index of European temp hours worked rebased to 100 in 2008. Source: BNP Paribas Exane. Data as at 31 December 2023. FY24 is Man Group estimate.
Despite the double digit fall in volumes since 2019, revenue this year is likely to be nearly 20% greater than back in 2019. The revenue of staffing companies explicitly benefits from wage inflation given an economic model that commands a percentage of the value of the candidate placed. As a result, the revenue base of the business has grown substantially as wages have risen along with wider inflation.
Figure 15. UK Recruitment Business Revenue

Source: Bloomberg, Company Accounts. Data as at 31 December 2023.
However, profit generation this year is likely to be broadly similar to 2019, as labour inflation and under-utilisation within their own business have kept margins in check. Again, the market remains fearful that this remains a cyclical business and their earnings are ‘yet to crack’, but this misses the ‘volume recession’ they have already faced. As volumes recover over the coming years, we think profit could be 20-30% higher than in the past, a thesis supported by management’s seemingly ambitious medium-term targets and compensation incentive structure.
Figure 16. UK Recruitment Business Profit
Source: Bloomberg, Company Accounts. Data as at 31 December 2023.
Not only do we think profitability will be significantly higher than in the past as volumes recover, but we can own the equity at a discounted valuation on depressed forward earnings today.
Figure 17. UK Recruitment Business Blended Forward PE
Problems loading this infographic? - Please click here
Source: Bloomberg. Data as at 31 December 2023.
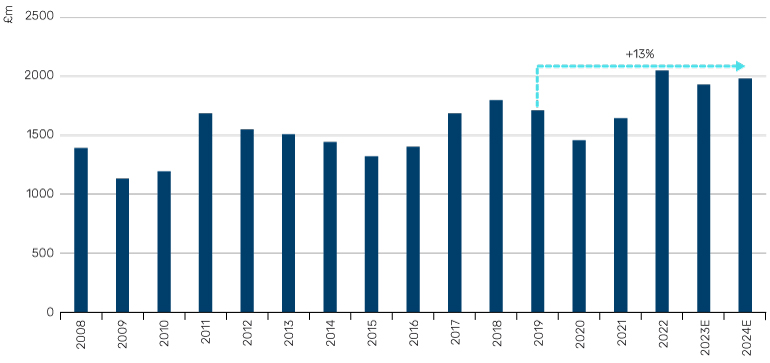
Finally, take a UK Brick Manufacturer. The well documented rise in mortgage costs has had a significant impact on the demand for new housing and the slowdown in secondary housing transactions has had a knock-on effect to the demand for RMI supplies. As a result, UK brick market deliveries this year are expected to be 30% lower than in 2019 – with demand as low as the trough of the GFC. It’s already bad.
Figure 18. UK Brick Deliveries
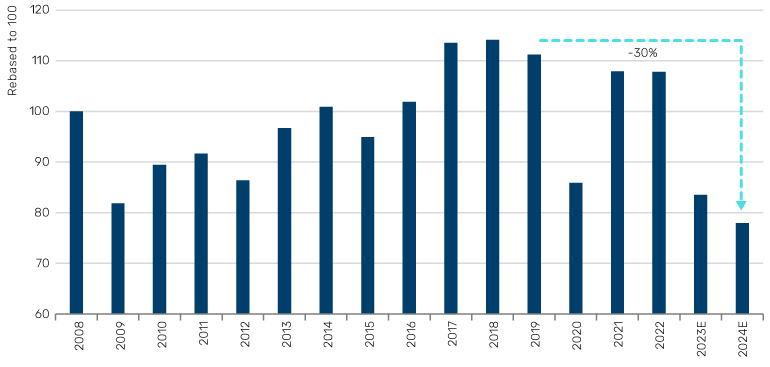
Shows UK brick market deliveries rebased to 100. Source: ONS, available here: https://www.gov.uk/government/collections/building-materials-and-components-monthly-statistics-2012Data as at 31 December 2023.
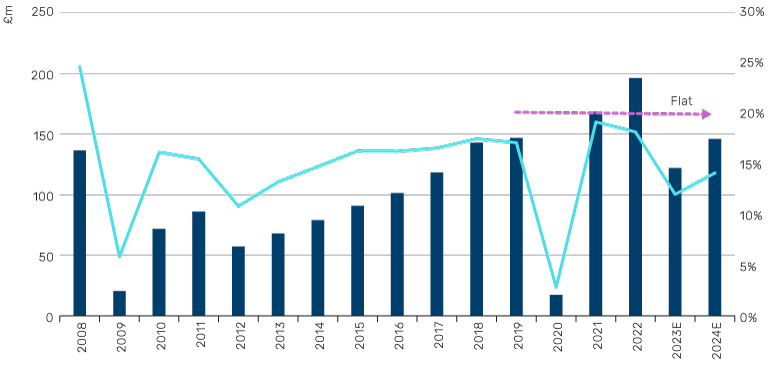
Despite that, again, based on our analysis, revenue this year is likely to be up 10% on 2019 as significant inflation in energy, raw materials and labour costs have been absorbed into the cost base and passed on to customers through higher pricing.
Figure 19. UK Brick Manufacturer Revenue
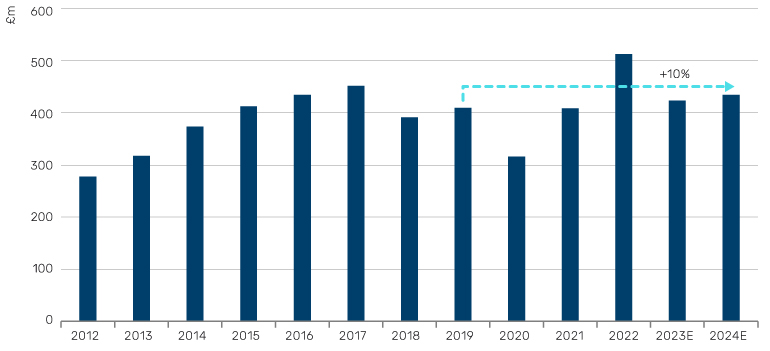
Source: Bloomberg, Company Accounts. Data as at 31 December 2023.
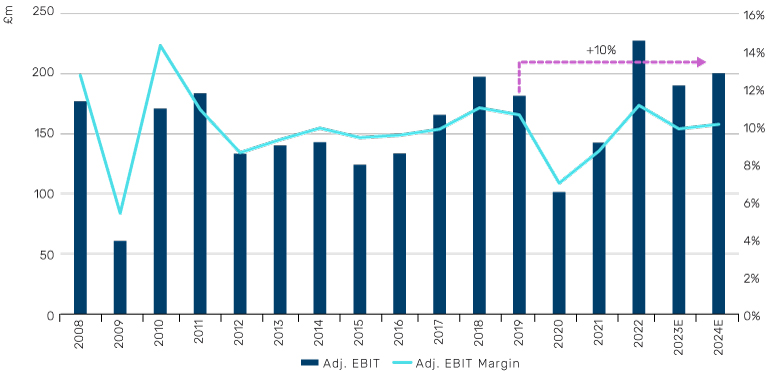
The impact of negative operational gearing to profitability has been more extreme here, given the fixed cost base nature of the business and hence profits are down over 40% compared to 2019. The impact of the ‘volume recession’ is more pronounced on the income statement and has not entirely been hidden by nominal growth. Though the fundamental point remains – when volumes in this business recover towards 2019 levels – it will make significantly more profit than it did back then. Based on our analysis, revenue and profit will likely be 30-40% higher than in 2019 for the same level of deliveries, yet consensus models profit only returning to 2019 by 2026 and never going above it.
Figure 20. UK Brick Manufacturer Profit
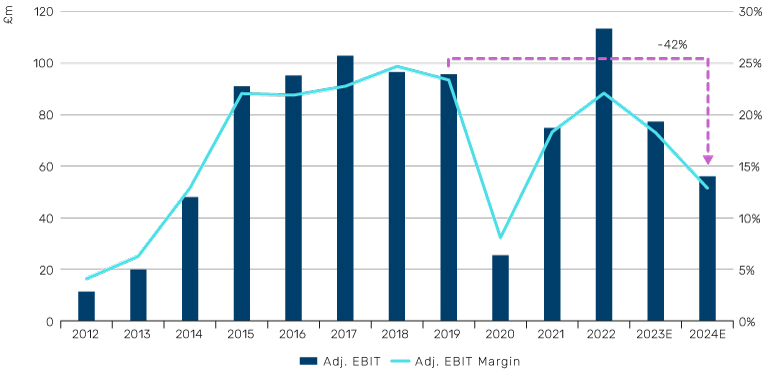
Source: Bloomberg, Company Accounts. Data as at 31 December 2023.
Not only do we think the company will generate significantly more profit in the future than in the past once volumes recover, but again we get to buy the equity today at a discount to its long-run valuation and with a depressed earnings number. As the chart below shows, the shares trade on less than 10x depressed blended forward earnings, below the long-run average of 12x and despite earnings being 40% lower than in 2019… and we think they can be 30-40% greater than 2019 once volumes recover.
Figure 21. UK Brick Manufacturer Blended Forward PE
Problems loading this infographic? - Please click here
Source: Bloomberg. Data as at 31 December 2023.
Summary
Over the last few years, we have experienced a period of significantly elevated inflation around the world. In the short term, this can lead to periods of over- and under-earning across different sectors and companies as inflation works its way through each business model and economic structure. More importantly, over the medium- to long-term, corporate earnings are a function of nominal GDP growth. While there are already many examples of where a higher aggregate price level and higher nominal GDP has led to higher profits in UK companies, it is not ubiquitous or well understood. There are several exciting pockets of the UK where we believe the market is pricing a significant fall in future earnings given cyclical concerns. In contrast, we believe these businesses have already had their ‘volume recession’, the impact of which has been hidden by higher nominal GDP. Going forward, not only do we expect those businesses to make significantly more profit in the future than they did in the past, as volumes recover, but we can own the equity in those businesses at discounts to their long run valuations today.
1. Where referenced, includes company audited financial statements, such as annual reports, or trading updates.
You are now leaving Man Group’s website
You are leaving Man Group’s website and entering a third-party website that is not controlled, maintained, or monitored by Man Group. Man Group is not responsible for the content or availability of the third-party website. By leaving Man Group’s website, you will be subject to the third-party website’s terms, policies and/or notices, including those related to privacy and security, as applicable.