Introduction
Most hedging conversations with investors focus on hedging the public portion of their equity portfolios. However, more recently, we have increasingly been receiving inquiries regarding hedging private equity (‘PE’).
These questions come even as allocations to PE have been increasing as a percentage of overall assets. Public pensions awarded 64% more mandates in PE in 2018 than they did in 2017.1 Typically, little to no capital is allocated to managing PE risk, even though underlying assets are effectively leveraged equity. In part, risk mitigation in PE poses a challenge as cash flows generally do not support much capacity to spend on option premiums.
However, investors may also be taking comfort from the low volatility of the reported returns and seemingly relatively benign drawdowns during crises.2 While these very smooth returns imply low risk, we believe investors would be wise to judge those reported results cautiously.
Figure 1. Leverage Is Increasing
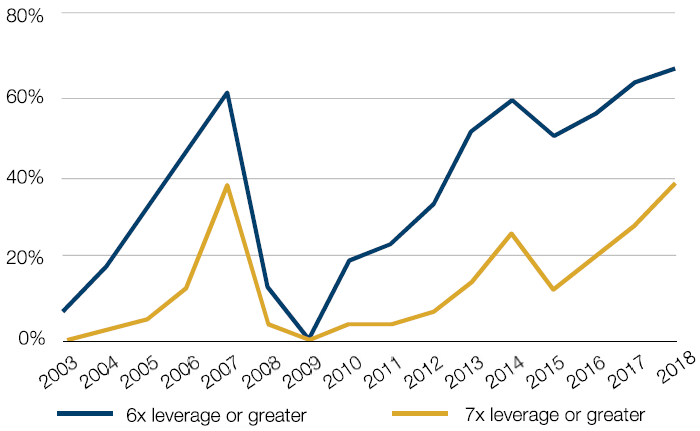
Source: Bain & Co.3 (citing Loan Pricing Corp data); as of end 2018.
Indeed, recent data may be altering the perception of PE risk among investors. First, with relatively low cost financing available in the leveraged loan market, the percentage of companies acquired at 7x leverage has, once again, reached 2007 highs of 40%. Meanwhile, the average EBITDA4-to-purchase price multiple of acquisitions remains at historically high levels (Figures 1, 2) with more than USD2 trillion of buying power at PE firms potentially being deployed at current valuations.5
As such, tail risk in new investments may be greater than the very smooth track records may suggest. Further, there is the possibility in a large scale crisis that high valuation premiums turn into discounts if investors are forced to monetize PE holdings.
Figure 2. Multiples Are at a High
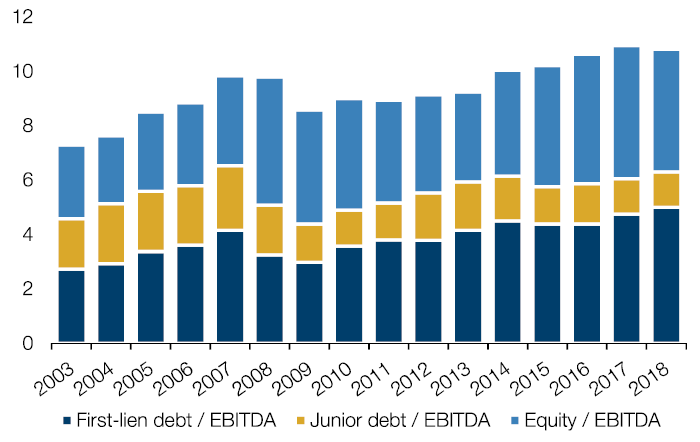
Source: Bain & Co.3 (citing Loan Pricing Corp data); as of end 2018.
One of the challenges in discussing hedging PE is determining what the true risk of the investment really is. Drawdowns in 2008/2009 appear to be quite low at 25%, according to the Cambridge Private Equity Index. Additionally, volatility seems almost non-existent in long-term returns, with a calculated beta to the S&P 500 Index of 0.5 and realized volatility of 9% since 2005 (versus 16.5% in S&P 500).6
A number of academics have attempted to come up with calculations of beta and volatility that more accurately reflect the true risk of PE with a recent study reaching a beta of 0.86 and MSCI-BARRA finding a beta closer to 1; however, these results still seem rather unsatisfying. While beta may be an interesting qualitative measure of risk, we believe investors should be most concerned with potential drawdowns.
The first part of this paper will provide some framework for determining whether the downside risks of PE are accurately reflected in PE indices. While leveraged exposure to equity indices is frequently used as a proxy for PE, this paper will present three other approaches that can be used in evaluating PE risk using public securities. That analysis then naturally leads to potential hedging solutions and may illuminate whether the excess returns demanded by investors for illiquid assets are high enough versus the risks taken.
Measuring Tail Risk and Volatility of PE
There is no shortage of debate regarding the actual risk of PE versus the perceived risk generated by the smoothed effects of how PE stakes are marked to market. A number of papers have been published on the topic, with Stafford and Jurek (2015) demonstrating that “over the period from 1996 to 2014, return smoothing in just two key months (August 1998 and October 2008) is sufficient to statistically obscure the exposure to downside market risks”.7 Returns benefit from book value-reporting methods used by PE firms, which result in much lower volatility than marked to market public equities. Given the typical PE transaction increases a target firm’s leverage by between 30% and 70%8, one could conclude that a PE index with a daily mark to market might look more like a leveraged investment in the S&P 500.
Further, given the smaller capitalization of companies taken private, a better benchmark index may well be the Russell 2500 (the smallest 2,500 companies of the Russell 3000). The implication of both the leverage employed and the indices referenced as benchmarks may be that potential drawdowns and volatility of portfolios are greater than presently perceived or reported.
Replication of PE Using Public Proxies (Liquid PE)
The S&P 500 is a poor proxy for PE given the weighting of mega-cap companies. As a result, investors may prefer the Russell 2500. However, the index has many factors that may detract from it being a fair equivalent for PE, not the least of which is significant weighting in biotechs, utilities and REITS.
A better approach to replicate PE investments may be made by looking for publicly traded equities within these indices that best mimic private companies. An approach to this is discussed in an article Man Numeric wrote in July 2018,
Private Equity Goes Public. PE risk can be approximated via public equity using “statistical replication approaches that rely on regression based techniques to identify key drivers of PE returns and tilt the portfolio towards those”. Strategies looking to invest in public equities in this manner are frequently referred to as liquid PE with marketed benefits of higher liquidity and lower fees.
The Summer Haven Private Equity Strategy Index (based on the work of Erik Stafford) uses these sorts of techniques and thus forms a potential reference point in evaluating PE risk. The history in Figure 3 shows a similar slope and return structure to the Cambridge Private Equity index. Note, however, the significant drawdown in 2008/09 and the episodic drawdowns that stand out in the Summer Haven index, but not in the Cambridge series.
Figure 3. Long-term Returns Comparison
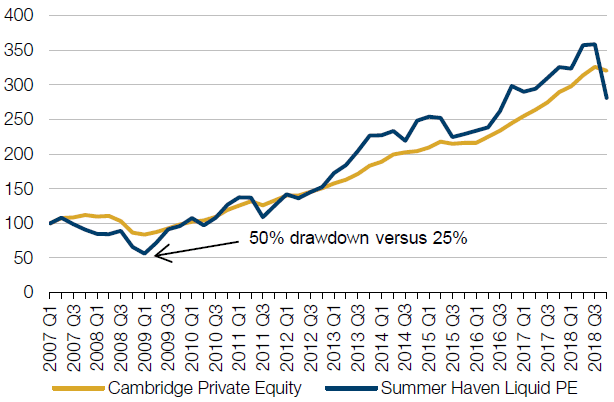
Source: Bloomberg, US Private Equity Index, Benchmark Statistics Cambridge Associates; as of 31 December, 2018.
The Summer Haven return series also appears more volatile over time. Figure 4 compares the annualized realized volatility of this index with the Cambridge PE index.
Figure 4. Comparative Volatility Analysis
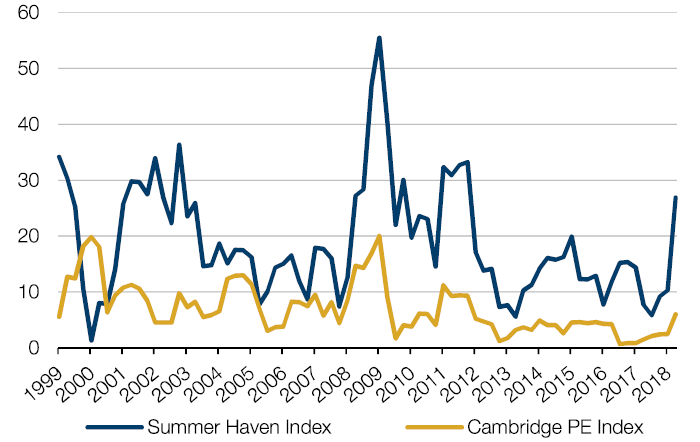
Source: Bloomberg, US Private Equity Index, Benchmark Statistics Cambridge Associates; as of 31 December, 2018.
Marking to Market Versus Book Value Accounting
Given the index is meant to replicate PE, there seems to be an argument that something is happening in the Cambridge PE return series that may be understating risk. The mark-to-market practice of PE tends to use their valuation estimates based on future cash flows and earnings, or based on book value without respect to what may be happening in the public market. In a November 2008 conference call, Blackstone President Tony James stated: "We take public [comparables] into account, but often we don't exit into the public market by doing IPOs, so they're sort of irrelevant."
In his work, Stafford points out that an equivalently levered portfolio in public securities would hypothetically show a maximum 15% drawdown based on book-value accounting methods versus an 85% decline when marked to market.9 This may account for why exchange traded funds with PE holdings managed by KKR and Apollo traded as low as 70-88% discounts to the reported values of their holdings.10 These are the same reported values that form the basis of the long-term Cambridge PE index. The debt of some private companies was trading at pennies on the dollar even as equities were held at only minimal markdowns in PE portfolios. Debt markets and exchange traded fund levels were signalling significantly larger markdowns than were being reflected in PE returns.
PE Firms
The arguments against public equity replication techniques include: that new management teams put in place by PE firms create value; that they are buying inexpensive companies with real potential cost savings; and that being out of the glare of public markets gives companies room to become more efficient and less worried about quarterly earnings. As such, replicating a PE portfolio with public equities may miss these key factors (which come at a very high cost of fees) and thus a true liquid PE index may not be possible.
Another approach would be to observe how stocks of PE and leveraged loan managers themselves perform during periods of stress. Using the largest publicly traded PE and private credit management companies, a synthetic index consisting of PE investment managers can be created.11 The only dissatisfying aspect of doing so is that some of the larger PE managers have only gone public by issuing their own equities in the last 5-10 years. As such, there is limited track record prior to 2011 and less data for the global financial crisis.
However, we can look at two windows of some stress: the credit meltdown in energy of 2015/2016 and the fourth quarter of 2018. From June 2015-2016, this PE managers index underperformed the S&P 500 by 24 percentage points, with a max drawdown of 36%. In the fourth quarter of 2018, the index performed a bit better, drawing down 24%, while the S&P 500 fell 19%. Neither period seems to be delivering the smoothed returns implied by Cambridge Private Equity Index which showed returns of -0.77% between the third quarter of 2015 and the first quarter of 2016, and -1.66% in the fourth quarter of 2018.12
Figure 5. Long-term Returns of PE Versus a Basket of PE Managers
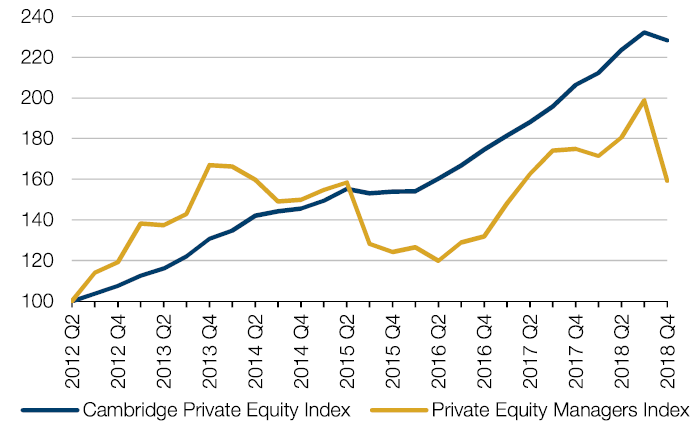
Source: Bloomberg Data, US Private Equity Index, Benchmark Statistics Cambridge Associates; as of 31 December, 2018. Simulated performance data and hypothetical results are shown for illustrative purposes only, do not reflect actual trading results, have inherent limitations and should not be relied upon.
Viewing through the prism of realized volatility, we find much consistently higher volatility for the PE managers synthetic index than the S&P 500. We have added the Russell 2500 to the analysis as well given that the profile of PE investments is more closely aligned with that index. The realized volatility of this basket is higher than the S&P 500 and the Russell 2500 over time. This once again highlights the smoothing effect in book value accounting and suggests that calculated Sharpe ratios for PE may be overstated versus the actual risk.
Figure 6. Realised Volatility Analysis
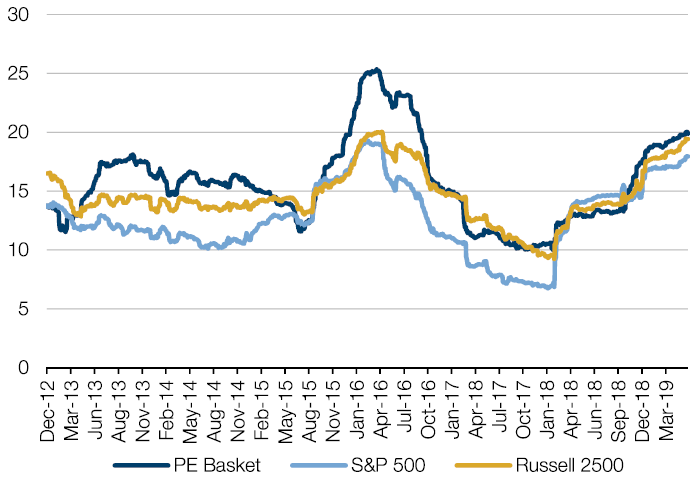
Source: Bloomberg; as of 12 June, 2019. Simulated performance data and hypothetical results are shown for illustrative purposes only, do not reflect actual trading results, have inherent limitations and should not be relied upon.
Leveraged Loans
A few things work against using PE managers as a benchmark for true returns of the asset class. First, PE firms are more sensitive to initial market declines as performance fees evaporate quickly and monetization opportunities diminish. Second, asset managers, in general, are facing wider challenges including fee compression. Finally, some PE managers have been adding substantial exposure to real estate, which may (or may not) prove diversifying in a crisis. As such, we may need to look toward other assets. Leveraged loans may address the objections against replicating via public equities or using a basket of PE managers as they are direct obligations of companies held in many PE funds. In fact, loans should be less at risk than equity given their senior status in the capital structure.
The S&P/LSTA Leveraged Loan price index experienced a drawdown of 38% in 200813, which was much larger than the 25% reported decline in the Cambridge PE Index. That alone should be informative. However, the underlying loans of the index are not always liquidly traded and thus, true market values may not always be known. As such, another approach may be to look at the publicly traded stocks of companies primarily investing in loans of private companies as a more liquid proxy. To that end, we create another synthetic index, but in this case, one consisting of a basket of business development companies that hold these loans.14 Although some companies launched after 2009, there were enough in existence to form a basket that existed during the crisis and then a wider, more inclusive basket from 2011 onwards. The two histories, along with the Cambridge Private Equity Index, are shown in Figure 7. Once again, drawdowns are severe, with 2008 showing a 60% drawdown (versus PE index -25%) and then 2015/16 peak to trough of -30+% (Cambridge PE index -15%).
Regardless of the leverage taken by these investment vehicles, the drawdowns on their loan portfolios suggest equity mark to market during the crisis may have been worse than implied by Cambridge data. In any case, we should not expect loan portfolios to draw down more severely than equity portfolios. Note that no attempt has been made to evaluate the evolving nature of the leveraged loan industry either positively (more liquidity and foreign investors) or negatively (re-emergence of covenant light loans and leverage levels of issuers). The objective is just to look at PE risk through the window of leveraged loan returns.
Figure 7. Business Development Companies Versus PE
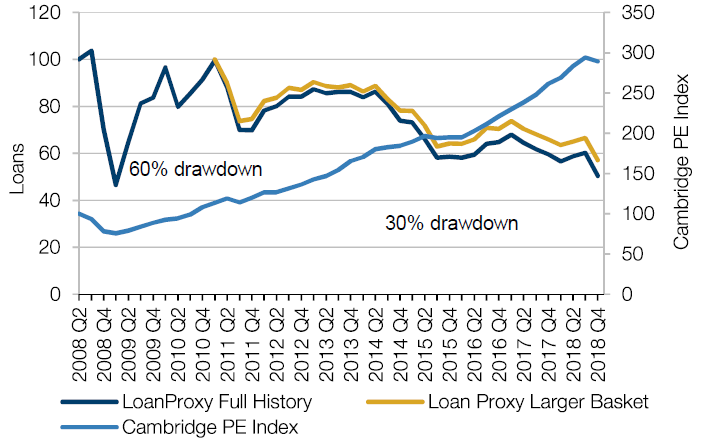
Source: Bloomberg, US Private Equity Index, Benchmark Statistics Cambridge Associates; as of 31 December, 2018. Simulated performance data and hypothetical results are shown for illustrative purposes only, do not reflect actual trading results, have inherent limitations and should not be relied upon.
Hedging
Having shown that other valuation techniques suggest that both drawdown and volatility risk of PE portfolios are potentially more significant than suggested by the return history of the Cambridge PE index, the next logical step is to consider hedging.
The most liquid hedges to equity tail risk are clearly in options on the S&P 500. However, with PE weightings already growing in their portfolios, investors using S&P 500 put options to hedge would effectively be decreasing public equity exposure in their attempt to reduce tail risk of their PE allocation. Further, as any value investor might tell you, hedging value stocks has been quite difficult with equity index options. This same problem may arise with PE.
Given we are unable to hedge PE directly, to the extent PE valuations are ‘rich’ when compared with public equities, there is little we can do to directly hedge that valuation differential. However, our goal is to hedge the tail risk of PE as best as possible without concentrating hedges in ways that diminish intentional allocations to public equities – passive, active or otherwise.
Using S&P 500 and Russell Small Cap Index
Notwithstanding the above, if the risk is defined as tail risk, why not simply use S&P 500? A 1-year 85% strike put as of 30 June, 2019 costs 2.2% and pays off in most significant drawdowns. Small-cap puts via the Russell 1000 index cost about 2.7% and offer similar characteristics in a crash.
Without knowing what the next crisis will look like, the first problem may be that the S&P 500 simply is not very similar to PE. Second, while a small-cap index improves upon the S&P 500 as a reference index, it still leaves investors unnecessarily short sectors including utilities, biotechs and REITS as part of the index. However, they do form useful hedging benchmarks and offer scalability.
For now, we will focus on the previous three approaches to evaluating risk of PE to come up with potential hedges.
Hedging Via Liquid PE Strategies
Having established several different approaches to evaluating risk of PE allocations via public equities, we now turn our focus to using these same strategies as underlyings for tail hedges.
Starting with Liquid PE, we could use the Summer Haven Liquid PE Index to develop hedges; however, without full transparency on constituents of the index or its construction methodology, using it to build hedges would be difficult. With assistance from colleagues at Man Numeric, we are able to create our own basket of stocks15 to mimic a liquid PE strategy. The goal is to create a reasonable proxy to use for potentially hedging PE holdings, albeit with some tracking error. In Man Numeric’s view, this means “avoiding large-cap stocks and marrying top-down industry tilts that match PE’s industry exposures with bottom-up proxies for buyout managers’ methods of identifying potentially undervalued companies”.16 In short, less utilities, less biotechs and less financials than the weightings in typical equity indices and, at the same time, avoiding ‘obvious’ non-targets such as low-profitability or high-valuation companies. An advantage of designing our own liquid PE basket is that by knowing the exact construction, hedges can be readily priced. Additionally, the basket can be modified to reduce the cost of hedging by removing components that are hard to borrow, hedge or otherwise impair the ease of trading for sellers of the options. One could also make the argument that in using these criteria, we are identifying companies that are likely known by investors as fitting into the PE mold and may already be valued at a potential premium to other stocks.
As shown in Figure 8, although based on a different construction method, the basket tracks the Summer Haven PE Index, with similar drawdowns throughout. Based on monthly returns, both show very large drawdowns in 2008 and then periodic shocks ranging from 19% to 25% in 2011, 2015 and 2018. Note that this proxy is a static index, while a typical liquid PE strategy would be dynamically managed through time. As such, returns of this static proxy will differ from an actively managed strategy. However, as the basis for 1- to 2-year tail protection, the proxy is sufficient.
Figure 8. Proxy Basket Versus Summer Haven Index Over Time
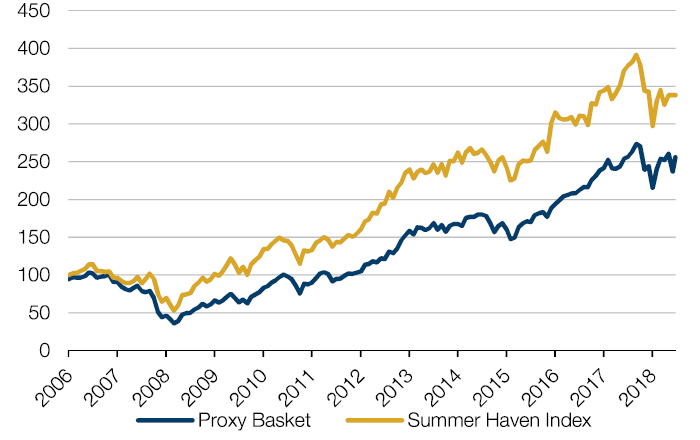
Source: Man Numeric; as of 20 June, 2019. Normalised to 100 as of 29 December, 2006. Simulated performance data and hypothetical results are shown for illustrative purposes only, do not reflect actual trading results, have inherent limitations and should not be relied upon.
In terms of hedging cost, a 1-year 85% put on the proxy basket can be purchased for a premium of 2.8%. This is similar to the cost of small-cap indices like the Russell 2000, but with less tracking error to PE. The put would wind up in the money in the aforementioned drawdowns during 2008, 2011, 2015 and 2018. In the event of the basket declining 20%, on a mark-to-market basis, the put would be valued at approximately 13% (or 17% if the basket were to be down 25%).17
Using put spreads rather than outright puts may be more interesting. In a put spread, the investor defrays some of the cost of buying puts by simultaneously selling a further out of the money put. The lower-strike put typically trades at a volatility premium due to high demand for the option. The strike sold, while capping protection, may well be a level at which investors would be content buying equities again. For example, buying a 1-year 90% put while selling a 70% put in S&P 500 reduces the cost by 75 basis points, compared with buying a 90% put outright. Investors are assuming market risk again at down 30%.
As hedges to public equity, often one worries that the mark to market of a put spread does not yield enough protection in a crisis, even if payoff at maturity is compelling. A 1-year 90/70% put spread might gain only 10% on a mark-to-market basis in a 30% decline, but a full 20% at maturity. However, in the context of PE which itself marks to market more slowly, this may be more acceptable. An 85/65% put spread on the liquid PE proxy basket would reduce cost to 1.94%. Alternatively, the 90/70% put spread costs 2.6% resulting in a higher put strike of 90%.
We can also consider selling a call on the liquid PE basket to fund the put. By selling a 1-year 115% call to fund the 85% put, we reduce the cost to 1.1%. The upside call sale does introduce potential risk that markets might rally significantly even before monetisations occur. However, it may fit in the context of portfolio rebalancing, especially with return expectations for global equities in the 5-7% range.18 Returns above 15% may be easier for investors to forego given those expected returns. The proxy basket shows drawdowns that exceed those of the S&P 500 in both 2011 and 2015. So, we have better protection for only a marginal increase in price and theoretically, more correlated to the assets being hedged (especially in 2015, when liquid PE declines far exceeded those of S&P 500).
Figure 9. Drawdowns in Market Corrections
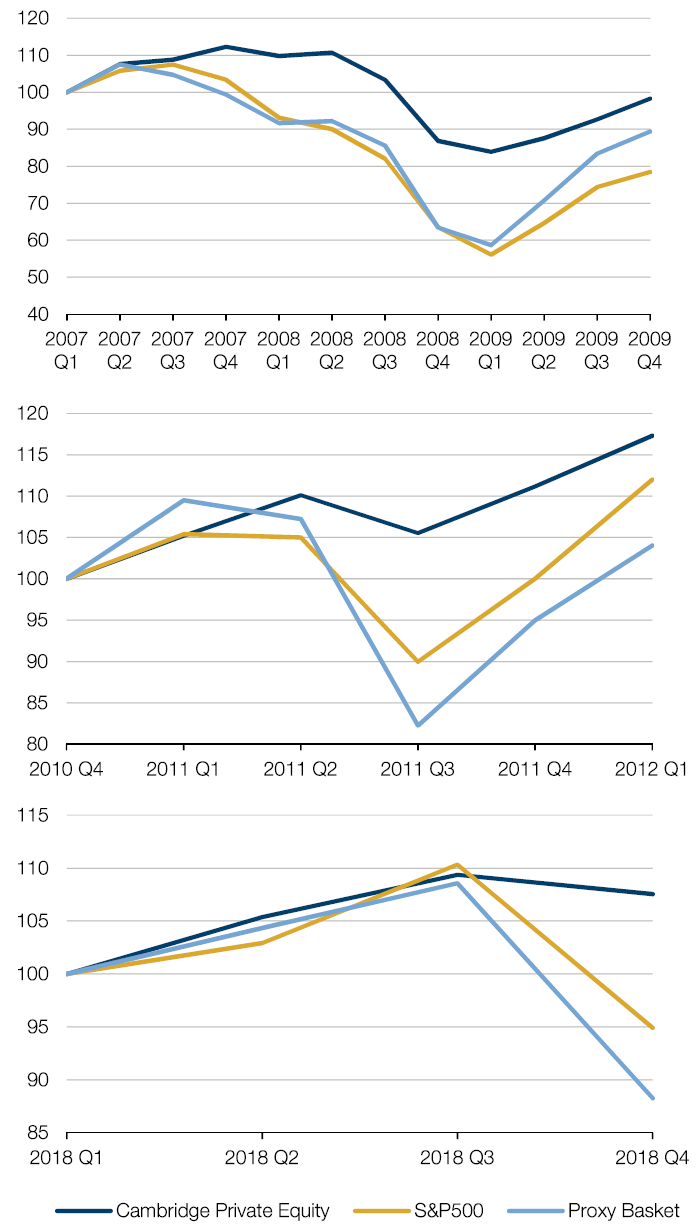
Source: Bloomberg, US Private Equity Index, Benchmark Statistics Cambridge; Between 2007 Q1 and 2018 Q4. Simulated performance data and hypothetical results are shown for illustrative purposes only, do not reflect actual trading results, have inherent limitations and should not be relied upon.
Using PE Managers as a Proxy Hedge
There is a certain compelling aspect to using a basket of PE managers to hedge. The sensitivity to markets is very high and thus, tail risk protection would historically have been robust. The erosion of performance fees directly impacts revenues of the PE investment managers and thus re-rating lower of managers happens relatively quickly. Although the firms have moved toward diversifying their revenue streams, the bulk of earnings continues to come from PE and credit with some diversifying into real estate.19 The cost of the 85 put climbs to a less satisfying 3.4% per annum; however, with historical drawdowns of 28% during the 2015 sell-off, the payoff remains relatively attractive even during less stressed broader market periods. The 85/65 put spread shows a cost of 2.4%.
While relying on complex options for tail hedging is something we approach cautiously, in this case, an underperformance option may be a useful tool; it allows hedges to benefit from industry-specific risk factors, causing greater drawdowns than broader markets. An underperformance option is one that profits when the target index underperforms the reference index. For example, we could strike an option based on how much this PE basket underperforms the S&P 500. (In 2015, that underperformance was as high as 25%. See Figure 10.) Striking the option at 5%, the put costs 1.94% contingent on S&P 500 being down. Using the 2015 underperformance of 20%, this means the option would be worth 15% at maturity (20% underperformance less 5% strike). Like other asset managers, PE may also face fee compression, which could lead to further underperformance even in benign drawdowns.
Figure 10. 2015 PE Managers Drawdown
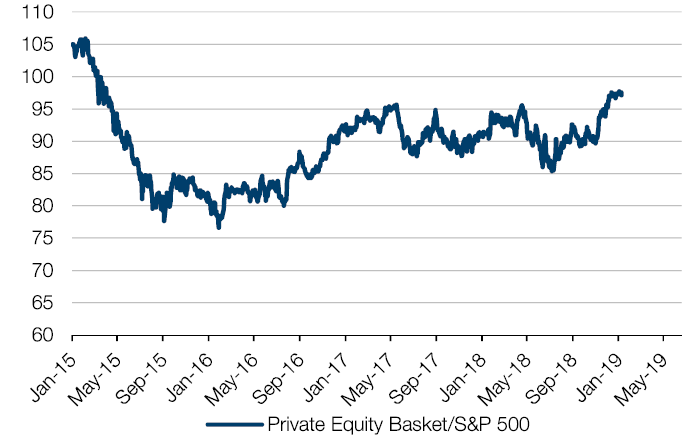
Source: Man Group, Bloomberg; as of 18 June, 2019. Simulated performance data and hypothetical results are shown for illustrative purposes only, do not reflect actual trading results, have inherent limitations and should not be relied upon.
Leveraged Loans
Finally, we can look to hedging using leveraged loans. Loans were the subject of much press coverage late last year due to performance but also due to weakening covenants.20 When the leverage loan market starts to suffer, refinancing for existing deals and capital for future deals becomes scarce. This is a condition that may be worth hedging. We start with the leveraged loan index (S&P/LSTA Leveraged Loan Index) despite showing some poor drawdowns for leverage loans management companies above.
Although historical drawdowns have been significant, an objection may be that current liquidity conditions may mean loans are likely to stay well bid. However, from a tail risk hedging perspective, the loan market offers risk and opportunities. Demand for riskier loans has jumped as collateralized loan obligations (‘CLO’) managers hunt for yield, allowing for cheaper financing for riskier companies. Presently, the share of debt in CLOs rated B or B- has grown to 40%, with a total of USD1.4 trillion in below-investment grade loans outstanding.21 Downgrades could force CLOs to sell riskier loans and/or leave issuers without the ability to refinance. Weakening covenants and lower-quality issuers has led Moody’s to lower recovery expectations to 61% from a historical average of 77%.21 Another concern that is harder to quantify is concentration of ownership. Japanese buyers have bought between 60% and 75% of all senior CLOs, with Norinchukin Bank alone owning USD61 billion.22 While they seem to have weathered the December sell-off, even a hint of them stepping back seems to send shudders through the leveraged loan industry.23 Further, that buying may be supporting issuance by lower quality companies who would otherwise pay more.
Despite the aforementioned risks, puts on the index should, and do, trade much lower in cost than equity puts. Simply stated, loans are supposed to be less risky than equity and thus, hedging should be cheaper. A 90% crash put is 1.45% and 90/75% put spread is only 1%. Drawdowns near 40% in 2008 and 10+% in 2011 and 2015 suggest the hedge provides protection with outsize gains in a 2008-style crisis.
While using the same index of business development companies (‘BDC’) from above increases the cost, the potential payoff soars as the basket of BDCs shows declines of 60% in 2008 and 30+% in 2011 and 2015. In this case, the value added for moving from the loan index to BDCs may be worth the cost, especially given the magnitude of the drawdown in 2015 when broader markets did not fall nearly as much. Both speculators and holders of illiquid loans may again seek to short BDCs as the only liquid securities available in a crisis.
Figure 11. Business Development Company Return History
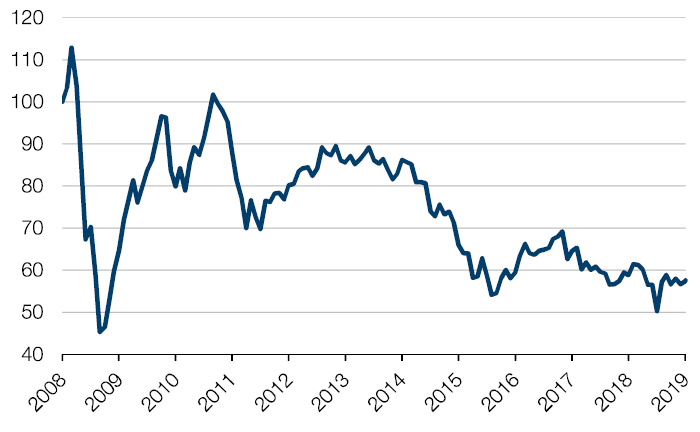
Source: Man Group, Bloomberg; as of 2 July, 2019. Simulated performance data and hypothetical results are shown for illustrative purposes only, do not reflect actual trading results, have inherent limitations and should not be relied upon.
Divesting or Reducing Allocations: Illiquidity Premium Over Time
One of the difficulties of advising clients on hedges has been that clients want to reduce downside, but without changing their investment allocation. For example, low-volatility stocks have had a run of outperformance recently and, contrary to what one might expect, have become expensive to hedge (currently 80th percentile in terms of expensiveness versus S&P 500 puts). In fact, given the cost, the better asset allocation choice may not be hedging, but rather selling and increasing allocations to other assets. Similarly, investors may consider asking themselves if current valuations in overall markets suggest that they should be demanding more for the illiquidity premium associated with PE.
A recent trend toward mega-cap PE funds has done little for returns, with PE funds greater than USD10 billion in size showing returns only 0.3% higher than the S&P 500.24 Potentially, the illiquidity premium meant for investors has flowed to PE managers in the form of fees. At the same time, as discussed above, investors are being asked to take more leveraged equity risk at historically high valuations. As return expectations come down in all asset classes, the spread between expected private and PE returns has fallen to a range of 2-2.5%.25 Investors are left with more risk and lower return expectations. At this stage of the cycle, keeping investments liquid such that they can be actively risk managed may well be worth more than the diminished return expectations of PE (especially when considering the fees paid). In other words, the best hedge may simply be reducing investments in PE.
Liquidity and Choosing From Among Hedge Alternatives
Figure 12. Hedging Costs, Return Data
|
Global Financial Crisis |
2015/16 | 1-Year Put* |
Hedge P/L GFC |
Hedge P/L 2015/16 | Put Spread** |
115/85 Collar |
Underperf. Option |
|
|---|---|---|---|---|---|---|---|---|
| S&P 500 | -53% | -11% | 2.2% | 38% | 0% | 1.9% | ||
| Liquid PE (Private Equity Replicating Strategies) | -58% | -28% | 2.8% | 43% | 10% | 1.9% | 1.1% | |
| Private Equity Managers | – | -36% | 3.4% | – | 18% | 2.4% | 1.9% | |
| Leveraged Loans | -39% | -14% | 1.5% | 38% | 4% | 1.0% | ||
| Loan Proxies via BDC's | -60% | -33% | 2.6% | 57% | 21% | 2.1% |
Source: Man Group, Bloomberg. *85/65 put spread for Liquid PE and PE managers, 90/75 for Loans and 90/70 Loan Proxies. **85% put for Liquid PE and PE managers, 90% for Loans and Loan Proxies. Simulated performance data and hypothetical results are shown for illustrative purposes only, do not reflect actual trading results, have inherent limitations and should not be relied upon.
Figure 12 shows hedging costs and some return data for some of the hedging strategies described earlier. Using PE-specific hedges improves upon S&P 500 hedges during periods when factors relating to PE or private credit are under particular stress. While each hedge approach is supported by past returns and perhaps convincing narratives, choosing from among them is not very straightforward. Loans may remain well-bid even as the economy sours, and investment fees may support PE managers through a downturn. Given the idiosyncratic risk of each, the simple solution to deciding among these hedges may be to use a combination of them as disaster protection. This picks up the lower cost of hedging loans, while maintaining the efficacy of the other PE proxies. Diversifying hedges may result in a more sustainable long-term program as the portfolio is not reliant on any one hedge.
Liquidity will be a key determinant in hedging. As implied by its name, liquid PE may offer the best liquidity as baskets can be continuously optimised to allow investment bank counterparties to provide option protection. This brings public market liquidity to PE hedging and allows for customization of proxy baskets based on investor exposures. A further possibility would be the creation of a basket of securities that track PE well. However, based on some other metrics, this may be riskier, more highly valued or otherwise a ‘better’ basket to short. No attempt was made in this paper to optimize the hedging properties of the basket in that manner.
Leveraged loans may also offer more depth for hedging given the size of the loan market. On the other hand, the indices of business development companies and PE managers may offer less liquidity and thus, higher costs. As with any hedge plan, trade-offs are many and thus, the key is to develop a program taking all factors into account.
A variety of potential hedges have been introduced in this paper; however, other alternatives may be available as proxies, including baskets of recent initial public offerings (‘IPOs’) to hedge venture capital or an index composed of companies increasing leverage to fund stock buybacks as a leveraged buyout (‘LBO’) proxy.
As with any program, there is much to consider in designing the right set of measures, implementation timelines and monetization goals. The right hedge may well change from one market regime to the next so investors will need to be flexible.
Conclusion
Whether long-term excess returns of private over public equities are due to leverage, due to improved management of target companies or due to an illiquidity premium is open for debate. The goal of this paper is not to analyse the quality or source of those returns, but rather to consider the risks of the investments and the availability of hedges for those risks. That said, in theory, hedging would isolate the contribution of the illiquidity premium and contribution of improved management to total returns.
While PE has offered the appearance of stability in previous crises based on reported drawdowns and returns, the public market proxies above have shown markedly different risk profiles with higher volatility and drawdowns than PE indices. From liquid PE replicating strategies and loan indices to PE managers themselves, mark-to-market losses far exceeded those of the Cambridge Private Equity index. This is consistent with academic literature attempting to assess the nature of PE risk. We believe that the profile of the underlying investments held by PE firms should be the criteria used to determine the relative riskiness of the investment, not just a track record which for idiosyncratic reason may potentially understate risk. As discussed above, the increasing leverage and higher valuations of acquisitions being undertaken today may be indicative of greater risk ahead. While realized volatility of the smoothed PE return stream may lead to interesting Sharpe ratios, we believe that the most relevant risk to be considered is drawdown or crash risk.
If an investor believes in the return differential of PE over public equity persisting in the years ahead, then that leaves open the possibility of using some of that excess return to mitigate tail risk. This may add further stability to the portfolio and potentially allows investors to avoid testing the liquidity of private markets in times of crisis. It may seem ironic, but it is important that the hedges outlined above are mark-to-market securities and, therefore, potentially monetisable in large market declines. It may appear that investors would be receiving all the benefits of smoothing on their PE investments and of marking to market on their hedges; however, we believe the risks are aligned with differences being marking and timing issues.
By viewing the track record in isolation, investors may be ignoring drawdown risk at their peril. It would be akin to assuming that since public equities have not experienced losses similar to those of 2008/2009 in the last 10 years, that the next 10 years should look the same; however, a risk manager would not presume to model risk going forward using only these more positive 10 years of data. Given the risk, if investors are thinking to hedge or reduce their portfolio exposures, we believe that PE should be included in these discussions.
1. Public Pensions Pour More Money into Private Equity, Institutional Investor, January 2019.
2. Cambridge Private Equity Index Data.
3. Global Private Equity Report 2019, Bain & Company (Pages 9-10).
4. Earnings before interest, tax, depreciation and amortisation.
5. ‘Private Equity Races to Spend Record $2.5 trillion Cash Pile’, Financial Times, 26 June, 2019.
6. Alexandra Coup (2016); Assessing Risk of Private Equity: What’s the Proxy?
7. Erik Stafford (2015); Replicating private equity with Value Investing, Homemade Leverage, and Hold-to-Maturity Accounting.
8. Ulf Axelson, Tim Jenkinson, Per Stromberg and Michael S. Weisbach (2013); Borrow Cheap, Buy High? The Determinants of Leverage and Pricing in Buyouts.
9. Erik Stafford (2015); Replicating private equity with Value Investing, Homemade Leverage, and Hold-to-Maturity Accounting.
10. ‘Ka-Boom!’, Barrons, February 2009, Andrew Bary.
11. Constituents of the index (equal-weighted in dollar terms) as of 31 May, 2019 are: 3I Group PLC, Intermediate capital group, Apollo Global Management, KKR & CO, Inc, Ares Capital Corp, IAC/Interactive Corp, the Blackstone Group, Partners Group Holding AG, Oaktree Capital Group and The Carlyle Group.
12. US Private Equity Index and Benchmark Statistics Cambridge Associates, 31 December, 2018.
13. Source: Bloomberg.
14. Constituents of the loan index consists of equal weighting of following equities as of June 15, 2019: Apollo Investment Corp, Eaton Vance Floating rate Income Trust, Hercules Capital, Prospect Capital Corp, Oaktree Specialty Lending, Portman Ridge Finance Corp. Shorter term history Loan Index includes the aforementioned plus FS KKR Capital Corp, TPG Specialty Lending, Golub Capital BDC Inc, Horizon Technology Finance, and Apollo Senior Floating Rate Fund.
15. Proxy basket’s top 15 holdings, in no particular order are: Cadence Design Systems, Inc., CDW Corporation, Charles River Laboratories International, Inc., Encompass Health Corporation, Fair Isaac Corporation, Genpact Limited, Hill-Rom Holdings, Inc., KAR Auction Services Inc, Keysight Technologies Inc, Outfront Media Inc, PVH Corp, Qiagen NV, Steris PLC, US Foods Holding Corp, The Wendy's Company.
16. Greg Bond and John Lidington (2018); Private Equity Goes Public.
17. Mark-to-market assumption based on sell-off occurring over 3-month period, with volatility increasing 5 points. In all periods, volatility increased by more than 5 points; however, we assume only 5 here. Vol data based on Bloomberg data.
18. JPM Asset Management Capital Market Assumptions for 2019.
19. Source: Bloomberg.
20. ‘Leveraged Loans Not as Safe as They Once Were’, Wall Street Journal, 15 August, 2018.
21. ‘Lower Recovery Rates to Haunt US Leveraged Loans’, Reuters, 17 August, 2018.
22. ‘How Japan’s Farmers and Fisherman Backed the Leveraged Loan Boom’, Financial Times, 18 February, 2019.
23. ‘Risky US Loan Markets Lean too Much on Japan’, Wall Street Journal, 26 February, 2018.
24. ‘Private Equity Firms are Raising Bigger and Bigger Funds. They Often Don’t Deliver’, Wall Street Journal, 18 June, 2019.
25. Source: JPM, Cliffwater and UBS Capital Market Assumptions for 2019.
You are now leaving Man Group’s website
You are leaving Man Group’s website and entering a third-party website that is not controlled, maintained, or monitored by Man Group. Man Group is not responsible for the content or availability of the third-party website. By leaving Man Group’s website, you will be subject to the third-party website’s terms, policies and/or notices, including those related to privacy and security, as applicable.