Is Private Equity overheating?
2017 was a banner year for private equity (‘PE’) as the industry cashed in on investors’ belief in its high returns and diversification potential and raised a record USD701 billion.1 This capped off a five-year period that saw USD3 trillion in capital raised, marking the strongest five-year stretch for fundraising in the history of the industry.2 This is a mixed blessing for PE managers. Committed capital is certainly nice, but finding attractive opportunities to invest that capital can be difficult since this enormous influx of money has resulted in stiff competition for deals, helping push valuation multiples to all-time highs (Exhibit 1).
Exhibit 1: US leveraged buyout purchase price multiples reached a new high in 2017
Enterprise Value to EBITDA3
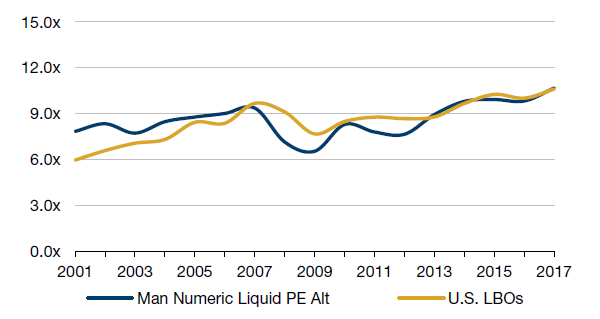
Source: Man Numeric and S&P Global Leveraged Commentary & Data (LCD) as of 12/31/17.
Building on research by Kaplan and Stromberg (2009) and Robinson and Sensoy (2012), Axelson et al show that PE returns have historically been negatively related to the amount of money flowing into the industry4 since economies can only absorb so much private equity capital. If there is an excess over this capacity of absorption, then valuations increase and returns are impacted.5
With capital flowing in and valuations rising, dry powder (committed PE capital that has not yet been invested) has increased steadily since 2012 and in 2017 surpassed USD1 trillion for the first time ever (Exhibit 2).6 It remains to be seen how quickly this money can be put to work, but there is no denying that the PE industry is in uncharted territory.
Exhibit 2: Private equity dry powder is at an all-time high7
Capital committed and not deployed, 2000–1H178
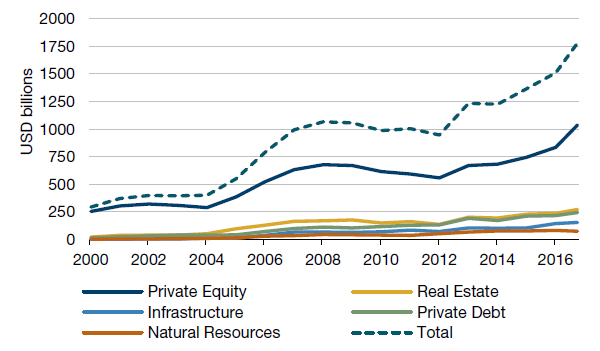
Source: Preqin as of 9/30/2017.
Increasing competition has also impacted valuations. With money pouring in and attractive economics for PE managers, talent has flooded into the PE industry and led to a remarkable increase in the number of PE firms over time (Exhibit 3).
Exhibit 3: The number of PE firms globally continues to climb
Number of active PE firms
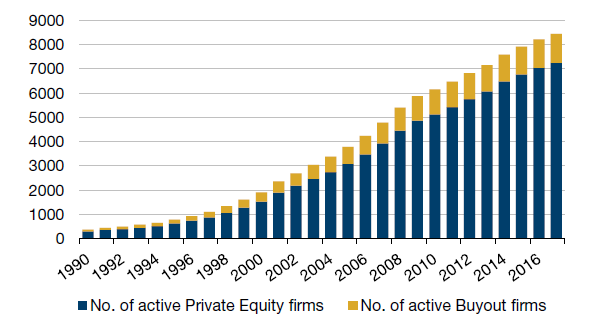
Source: Preqin.
Spurred by low interest rates, increasing deal leverage has also contributed to rising valuations. Easier credit leads to a more competitive market for LBOs9 and, correspondingly, the leverage of the deals in a particular fund is negatively related to the return of that fund. Furthermore, as debt is incurred, interest costs rise and bankruptcy risk increases.10 In addition to increasing the explicit and implicit costs of leverage in a buyout, higher interest rates make it more difficult for acquirers, which have historically tended to borrow money to buy companies, to turn a profit on an acquisition. This negatively impacts a popular exit strategy for PE portfolio companies as acquirers’ purchasing power depends partly on their ability to raise debt at a cheap price.11
As deal valuations rise, PE managers can 1) be disciplined about not overpaying for deals and keep cash on the sidelines while waiting for attractive opportunities12, or 2) pay premium multiples for companies, which means that multiple expansion, a significant driver of the industry’s historical returns, may play a less substantial role than it has historically.13 If the latter, the pressure may increase on PE general partners (‘GPs’) to produce returns through top line growth and/or operational improvements. This may be easier said than done for many GPs.14
This perfect storm of competition for deals, record-high valuations, unprecedented levels of dry powder, high leverage, and rising interest rates has galvanized some firms to create innovative solutions that aim to help investors achieve their strategic PE allocations prudently or sidestep potential issues in their PE portfolios, including cash drag and the risk and return mismatch that can occur when utilizing the blunt PE cash management instruments that have historically been available to investors. These market conditions have given rise to multiple ‘liquid PE alternatives’ that attempt to address the challenges investors face when investing in PE today.
Why would investors consider a liquid PE alternative?
In addition to the cyclical reasons for the increasing popularity of liquid PE alternatives, there may be other benefits from tackling some of the structural limitations of traditional PE, including higher fees, illiquidity, and limited transparency.15 Liquid PE products generally seek to address each of these with a more explicit focus on the first two.
Fees
Liquid PE alternatives tend to be more cost-effective than traditional PE funds, often with lower management fees and no performance fees.
With capital flowing into their coffers, we believe that traditional PE firms are unlikely to reduce their fees in the near future. While investors do not want to pay dearly for PE funds that do not deliver ‘alpha’, in the absence of investable alternatives to PE, most have little leverage in negotiating fees as they fill their strategic allocation to PE.
Since liquid PE alternatives seek to provide investable portfolios that mimic the PE asset class, investors may be able to more easily distinguish between replicable return drivers and the pure alpha or value-added that PE managers seek to generate.16 This can potentially help limited partners (LPs) assess whether they are getting what they pay higher fees for or paying largely for economic tailwinds and corresponding multiple expansion plus a healthy dose of leverage.
Illiquidity
PE’s inherent illiquidity is understood, accepted, and seems unlikely to change, making it difficult for investors with significant liquidity needs to invest. Illiquidity itself is not necessarily a bad thing for many investors with no liquidity constraints, but now that there are liquid PE options with no lockup periods, even these investors may want to scrutinize whether they are being compensated with a sufficient PE illiquidity premium versus public market comparables.
Transparency
Transparency may be improving with some PE managers, but it can still be difficult to get detailed information about the true current valuations of PE portfolio companies and the methods that GPs pursue to try to extract value from them. Public equity-based liquid PE alternatives can provide more transparent, often rules-based, investment processes and typically a daily valuation for the portfolio and its underlying companies.17
Timing
Another potential benefit of liquid PE, and perhaps an important one at this point in the PE cycle, is the flexibility it gives investors who are wary of investing at an inopportune time. Current valuations have many investors questioning whether now is the right time to lock up capital in traditional PE funds for an extended period of time.
If capital has already been committed, there is the question of how to invest it while waiting for it to be called by GPs, who could conceivably stick to their valuation discipline for years. Depending on which cash management solution investors use while waiting for capital to be called, years of cash drag and/or a risk and return mismatch with traditional PE could lead to undesirable outcomes.
It is against this backdrop that new alternatives to traditional PE have arisen.
The different forms of liquid PE
For years, a popular way to ‘equitize’ committed but not yet called capital has been to invest in public equity indices like the S&P 500 or, for a closer match in terms of PE company size, the Russell 3000®. These may be suitable, albeit suboptimal, proxies for PE given that public and private companies can respond in similar ways to numerous top-down influences. Liquid PE alternatives, however, seek to provide investors with the potential of more PE-like return profiles and risk exposures than these broad public equity indices while preserving liquidity to meet capital calls.18
Some liquid PE strategies also have the ability to more actively refresh portfolio holdings and buy when public equity markets decline as opposed to the potential risk of being locked into higher valuations for years, as may be the case with traditional PE.19
While their ultimate goal may be the same, approaches to liquid PE vary significantly and differences in investment process can lead to a wide range of potential investment outcomes.
Active microcap public equity
Managers using this approach invest in smaller public companies, often using traditional stock selection approaches to try to identify the most attractive stocks in the overall microcap universe. The average PE target is smaller in size than the market capitalization of most popular public equity indices (e.g., S&P 500, Russell 3000®), so there is some intuitive alignment with PE by simply investing in companies of a similar size.
Advocates of this approach have pointed out that management teams at microcap companies may have their interests more closely aligned with those of traditional PE management teams, as proxied by the levels of ownership by insiders and private investors. While this is a convenient by-product, focusing primarily on small size while using traditional stock selection processes does not always serve as a proxy for what PE managers focus on in their deals.
Furthermore, by virtue of investing in a less liquid segment of the market, microcap managers need to run their strategies with lower capacity limits (which may not be very helpful when there is over USD1 trillion in PE dry powder) or they risk missing the mark on one of the primary goals of liquid PE strategies – liquidity.
Portfolios of publicly listed PE firms
This approach focuses primarily on investing in publicly-listed PE firms. This may provide more exposure to the economics of a PE firm and less exposure to the returns of the funds that the PE firm manages. Furthermore, the large listed PE firms are typically more diversified and can trade like other diversified financial services companies. In addition, the number of listed PE firms is relatively small, so there is the risk of insufficient breadth or diversification in a process like this.
Statistical replication
Purely statistical replication approaches rely on regression-based techniques to identify key drivers of PE returns and tilt the portfolio toward those. These can include sector tilts based on efforts to identify which sector exposures are most significant in explaining PE returns. Practitioners of this approach might laud the benefit of using regressions that can capture multiple sector exposures that a diversified company has rather than forcing that company into a single industry classification, while critics might point to the potential risk of overfitting or spurious results. For statistical approaches based on cash flow data, there is also the potential drawback that this data is typically available only quarterly.
Proxies for PE’s primary return drivers
Buying undervalued assets can be a critical driver of PE returns, as can skill in increasing a company’s growth and/or making various operational improvements to a business. In addition, industry timing can be a significant driver of returns. If, and only if, value has been created through these or other channels, then leverage can become an important amplifier of returns as well.
Some liquid PE alternative strategies focus on mimicking one or more of these drivers of PE returns. In an environment in which GPs may need to increase their efforts to grow companies’ top-line or pursue operational improvements to try to generate attractive returns (since they may not be buying cheap), liquid PE strategies might be considered incomplete without some proxy for these sources of PE’s potential value added.
Another approach, tilting one’s portfolio to sectors or industries favored by PE, can be done through statistical methods, but with some heavy lifting this approach can instead be based on transaction-level data from actual PE deals. This potentially creates a closer match with PE on top-down trends that can impact the returns for individual industries.
Some liquid PE strategies focus on the leverage component of PE’s returns. This may make sense superficially since buyout deals have historically tended to employ substantial leverage, but it can also obfuscate some of the nuances of leverage. In our view, leverage by itself is not an attractive feature and is not an efficient proxy for PE. As noted earlier, elevated levels of PE leverage can be a potential leading indicator of weaker PE returns, in which case trying to mimic PE leverage would seem to be a suboptimal solution.
As Ludovic Phalippou points out, leverage cannot be a source of value creation. Leverage simply magnifies the amount of value created, whether positive or negative.20 The latter point is important to emphasize, especially at a time when multiple leading indicators of potentially weaker PE returns, particularly purchase multiples and leverage levels, are at all-time highs. Risk increases as leverage rises, so if a GP loses money on a deal, leverage amplifies that loss.21 Thus, we believe it may be more prudent for liquid PE alternatives to focus on the underlying drivers of PE’s returns rather than the amplification of those returns.
In addition, research shows that public company debt is not always an appropriate proxy for the leverage employed by PE firms in their deals. According to Axelson et al, there appears to be no discernible relationship between leverage in buyout firms and median leverage of public firms in the same industry-region-year, regardless of which leverage measure is used.22
As illustrated, there are multiple approaches to try to create a liquid proxy for PE. In Man Numeric’s view, the ideal approach should avoid large cap stocks and marry 1) top-down industry tilts that match PE’s industry exposures with 2) bottom-up proxies for buyout managers’ methods of identifying potentially undervalued companies and unlocking that value through growing revenues, improving operations, and various other means.
New options for Private Equity investors
In Man Numeric’s opinion, the traditional PE model is not broken and the historical returns of the asset class may not be gone forever, as some have suggested. Rather, performance can be cyclical, as with any asset class, and there are multiple signals indicating that this might not be the most attractive point in the cycle to commit new capital to traditional PE. In particular, we believe higher valuations, increasing dry powder, considerable leverage, and rising interest rates should be taken into account when considering an allocation to PE or planning for a potentially extended period of time in which committed PE capital could go un-called.
What does a GP do in an environment like this? Options include 1) buy at higher multiples that they are then locked into, or 2) stay disciplined on valuation and wait for better deals. All else equal, the second option is preferable for most LPs, but given that it could take years for these higher valuations to unwind, they are then faced with a decision about how to best achieve PE-like exposures and returns on committed capital while waiting for it to be called.
The advent of liquid PE alternatives has provided a new set of options that allow investors to potentially achieve PE-like returns and risk exposures. At this point in the cycle, these alternatives may help investors avoid incurring the risk of being locked into higher valuations and the below average PE returns that have historically been linked to buying at higher valuations.
1. Bain & Co. Global Private Equity Report 2018. Page 14.
2. ibid. Page iii.
3. We define EV = Market Cap + Short-term Debt + Long-term Debt + Minority Interests + Preferred Equity – Cash & Equivalents. For our analysis here, we set EV* = max (EV, Market Cap), restricting Net Debt greater than or equal to zero.
4. “Borrow Cheap, Buy High?” Axelson, Jenkinson, Stromberg, and Weisbach. The Journal of Finance. December 2013. Page 2260.
5. “Introduction to Private Equity.” Demaria. Page 286.
6. Not helped by distributions outpacing capital calls for the fifth year in a row in 2017, and the seventh year in a row in the buyout segment. (Page 16 of Bain Global Private Equity Report 2018, based on Preqin data).
7. McKinsey’s February 2018 Global Private Markets Review (“The Rise and Rise of Private Markets”). Page 20.
8. Data not available for full 2017 year.
9. “Borrow Cheap, Buy High?” Axelson et al. The Journal of Finance. December 2013. Page 2263.
10. To be fair, some believe that increasing leverage instills discipline in PE’s management of companies, while rising interest rates have been linked to greater discipline in deal-making and are sometimes thought to be a leading indicator of declining valuations. The logic goes that as easy money dries up there is less competition for deals and valuations drop as a result. However, the extraordinary current levels of dry powder will likely see to it that increases in interest rates do not lead to a near-term decrease in competition.
11. “Introduction to Private Equity” Demaria. Page 80.
12. To quote Bain & Co. (Page 6 of Global Private Equity Report 2018), “the market has gotten frothy enough that many GPs are wary of doing what may turn out to be a weak deal under pressure,” as reflected in deal count dropping 19% from 2014, the high-water mark for deal activity in the current economic cycle (Page 2 of the same report).
13. While many PE GPs may not explicitly model significant multiple expansion into their exit scenarios when purchasing companies, the reality is that multiple expansion is an important return driver for the PE industry.
14. According to McKinsey (Global Private Markets Review 2018), “most are still searching for a successful formula” to reliably enhance portfolio company economics.
15. Demaria “Introduction to Private Equity” (Page 286), as sourced from JP Morgan Asset Management’s 2010 study of what LPs view as the leading drawbacks of PE.
16. Some even consider liquid PE alternatives as sophisticated benchmarks against which to measure PE productivity.
17. This paper focuses specifically on public equity-based PE alternatives. Man Numeric’s research shows that public companies are an appropriate proxy for private companies for a variety of reasons, including exposure to many of the same macroeconomic, political, and other top-down factors. This is reinforced by the PE industry itself, which commonly uses public equity market comparables in its valuation and other aspects of its process.
18. Typically public equity solutions with a heavy emphasis on buyouts specifically, perhaps in part because buyouts are the largest segment of private equity.
19. Perhaps exacerbated by the potential risk of being multiple years into an investment and having GPs decide that companies of this vintage are not the most promising for returns, in which case the GP will likely move on to more promising companies and spend less time working on companies of this vintage, as pointed out by Cyril Demaria on page 97 of his “Introduction to Private Equity.”
20. Phalippou, Ludovic. “Private Equity Laid Bare.” Page 58.
21. Phalippou asserts that, as a GP the more certain I am that what I am buying is cheap, the more leverage I should be using. To extrapolate, if PE managers were certain that they were buying cheap right now, we probably wouldn’t be seeing this massive accumulation of dry powder.
22. “Borrow Cheap, Buy High?” Axelson et al. The Journal of Finance. December 2013. Page 2225.
You are now leaving Man Group’s website
You are leaving Man Group’s website and entering a third-party website that is not controlled, maintained, or monitored by Man Group. Man Group is not responsible for the content or availability of the third-party website. By leaving Man Group’s website, you will be subject to the third-party website’s terms, policies and/or notices, including those related to privacy and security, as applicable.