Introduction
In March, the depths of the coronacrisis sparked a record flight out of emerging market assets. However, emerging markets is making a comeback as news of an effective vaccine have rekindled investor optimism and the hunt for riskier investments.
Still, we believe that it is prudent to remain cautious on emerging markets for five reasons.
First, we are anxious about the rising overall debt burdens in emerging markets. For the last decade, emerging-market (‘EM’) economies have experienced a typical debt overhang. This overhang has crowded out investment, consequently reducing growth rates and bringing many of these economies into a vicious circle where they cannot grow fast enough to stabilise debt as a share of GDP. If policymakers decide to stimulate the economy via fiscal or monetary policy, the deterioration of their export sectors (due to lower investment) make them unable to keep their current accounts in equilibrium as domestic economies expand and increase the demand for imports, an issue exacerbated by the pandemic.
Secondly, many believe that China will ride to EM’s rescue. However, contrary to what market consensus believes, the increase in the Chinese fiscal impulse which allowed that economy to recover to pre-pandemic activity levels has already been reduced. Growth in construction, one of the main drivers of the recovery, has already decelerated and will probably not be enough to keep metal prices at the currently high levels. Likewise, the temporary factors that drove to an up move in agricultural commodities seem to be coming to an end.
Third, conditions across the largest developed markets in the western hemisphere have deteriorated since the end of the third quarter. While this is not a significant influence for EM activity directly, it is unlikely to be supportive.
Fourth, with the Chinese yuan close to its most expensive levels from a real exchange rate perspective, and the US dollar near its average for the last 25 years, it is difficult to believe that the yuan has enough upside to be able to drive to a meaningful EM currency appreciation in real terms, much less in nominal terms.
Finally, the levels of risk run by investors in credit in general, and EM in particular, are exponentially higher than just a couple of years ago, after multiple iterations of quantitative easing.
Challenge 1: Debt Overhang and the Crowding Out of Investment
EM countries came into 2020 after years of building their debt stocks (Figure 1). This increase was the consequence of high levels of government spending maintained since 2007, when the initial peak in EM terms of trade coincided with very strong national balance sheets (probably the strongest ever).
Since the Global Financial Crisis (‘GFC’), the terms of trade for EM countries weakened and tax revenue as a share of GDP declined. As the horizontal axis in Figure 1 shows, spending as a share of GDP increased for roughly two-thirds of the countries and barely decreased for most of the others. In spite of this balance sheet deterioration, sovereign defaults remained relatively rare (except for the cases of Argentina, Belize and Mozambique), thanks to the abundant liquidity provided by quantitative easing from developed market (‘DM’) central banks.
With the onset of the pandemic in 2020, a significant contraction in economic activity ensued, producing a substantial deterioration in the fiscal performances of EM economies. Indeed, in 2020 alone, the 11% average fiscal deficit expected by the IMF for EM countries (even under the unrealistic assumption that GDP remain unchanged) would increase the debt/GDP ratio by a magnitude that would have taken seven years of debt accumulation in the 2007-2019 period. To further complicate the situation, it is unlikely that EM GDP will return to the levels that we had prior to the pandemic at least until well into 2022, as the availability of vaccines and their delivery infrastructure are less likely to be on hand than in the developed world. As such, fiscal deficits, weak activity and rapid debt accumulation in emerging markets are likely to persist through most of 2021.
Figure 1. Gross Government Debt/GDP Versus Government Spending/GDP
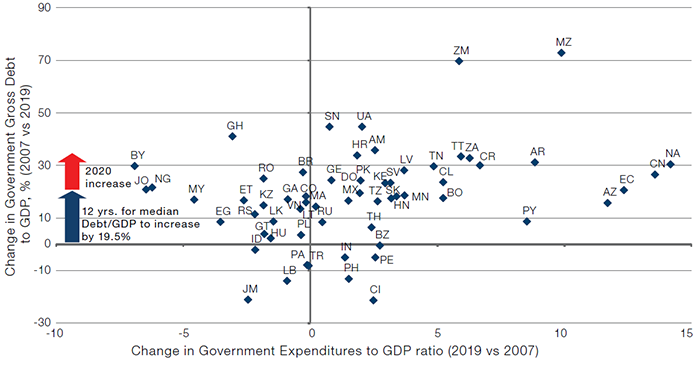
Source: IMF, Haver, Man GLG; as of 31 December 2019.
This debt overhang was the likely cause for the drop in EM investment from 2012 onwards (Figure 2). EM investment growth ran at around 10% a year for most of the 2000s, except for the recession in the early 2000s and the GFC, but decelerated markedly from 2012 on before falling off a cliff in 2020.
Figure 2. EM Investment Growth
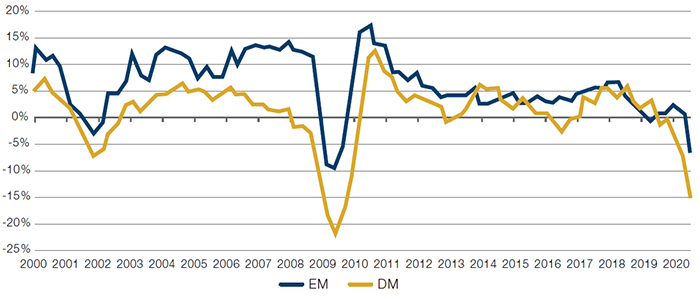
Source: EM Advisors Group; as of 16 October 2020.
Our view is that such a deceleration in investment, together with the deterioration in the terms of trade, was one of the main reasons for the disappearance of the GDP growth differential between EM and DM since 2014 (Figure 3).
Figure 3. GDP Growth – EM Versus DM
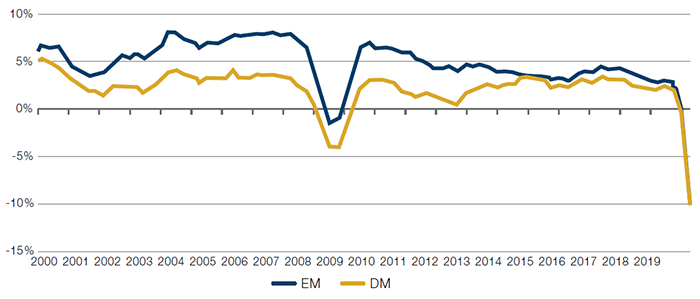
Source: EM Advisors Group; as of 16 October 2020.
Many of these economies have fallen into a vicious circle where they cannot grow fast enough to stabilize the debt/GDP ratio, and if they expand fiscal and/or monetary policy to stimulate growth, they quickly run into imbalances in their current accounts. This is due to a lack of export capacity, which is itself generated by insufficient investment (Figure 4).
Figure 4. EM Average Real Exchange Rate Valuation Versus USD, and Current Account/GDP
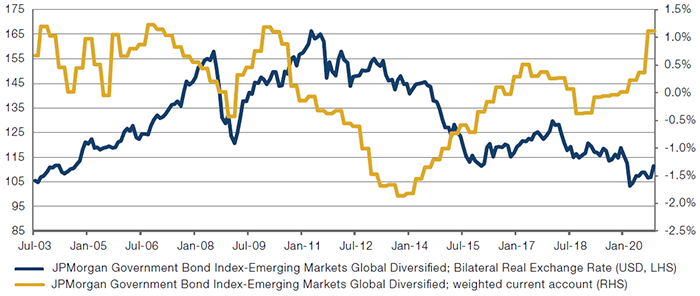
Source: Bloomberg; as of 30 November 2020.
The dark blue line shows the evolution of the real exchange rate valuation of the currencies that are part of the EM local bond index versus the US dollar. Since 2016, the composite exchange rate has been as cheap as or cheaper than the early- to mid-2000s. However, current account balances have been unable to get back to levels of strength seen before 2006, while coexisting with strong economic growth. Even with the massive decrease in imports triggered by the pandemic and the increase in commodity prices since the second quarter of 2020, current account balances have not been able to reach the peaks seen in the 2000s.
The majority of EM countries are in this vicious circle where if they grew fast enough to stabilise debt/GDP ratios, they would need experience current account imbalances, and if they correct such imbalances, then they do not grow fast enough to prevent debt/GDP from increasing.
The solution to this problem would require one or both of the following: improvement in the fiscal balances and/or reduction in the levels of debt. It is almost politically impossible for policymakers to deliver reductions in nominal spending or increases in nominal revenue (via higher taxation) at this point. For those countries that have floating currency regimes, inflation generated through currency depreciation can help address both the fiscal imbalances for as long as nominal spending grows more slowly than nominal revenue, and dilute the stock of local debt in real terms in the cases of countries where the debt was accumulated in local currency and long maturities. However, those countries that have heavily managed currency regimes, accumulated debt in foreign currency and make a living from exporting commodities are more likely to end up in defaults. Hence, it is difficult to be optimistic in general about local currency denominated assets, or hard currency denominated bonds from lower quality countries.
Challenge 2: China Is Unlikely to Pull EM Economies Out of Weakness
For some time now, market participants seem to have developed a consensus that Chinese credit injections – which, with the early exit out of the pandemic driven shutdowns and acceleration in exports allowed for GDP to recover above pre-pandemic levels – will support growth in the demand for products made by other EM economies.
Figure 5 explains why this reasoning is popular. The blue line shows the inverted spreads of the JPMorgan Emerging Market Bond Index Global index (‘EMBIG’), where an up move indicates spread tightening and vice-versa. Indeed, soon after EM external debt spreads tighten, Chinese authorities appear to inject increasing amounts of credit in the system. Hence, the theory goes that the substantial increase in credit impulse implemented so far in 2020 is likely to be followed by EM outperformance.
Figure 5. China Credit Impulse and EM Credit Spreads (Inverted)
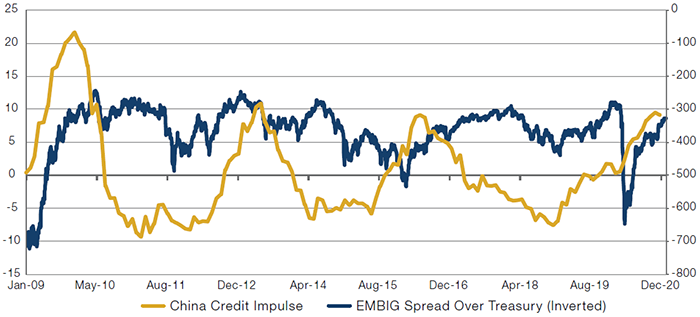
Source: Bloomberg; as of 14 December 2020.
Nevertheless, we believe that market participants are missing a wrinkle in the story. When looking at the changes in the amounts of credit injected in the economy on a monthly basis, there is a significant difference between the credit expansions of 2008-2010 and 2014-2016, versus the one in 2020. Figure 6 shows the changes in credit relative to GDP on a monthly basis and the 3-month moving average. In the two previous large credit expansions, credit injections stayed at very high levels for almost two years after the initial acceleration. However, in 2020, there is a large expansion in the second quarter that was largely reversed by the end of the third quarter.
Figure 6. China - Monthly Credit Impulse
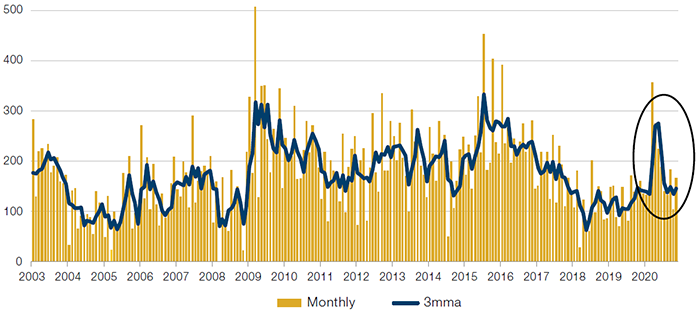
Source: EM Advisors Group; as of 21 October 2020.
Authorities probably closed the credit spigot because Chinese GDP had recovered back to pre-pandemic levels by the third quarter. Indeed, the level of leverage accumulated by Chinese households is already extreme (Figure 7).
Figure 7. China – Credit to Households
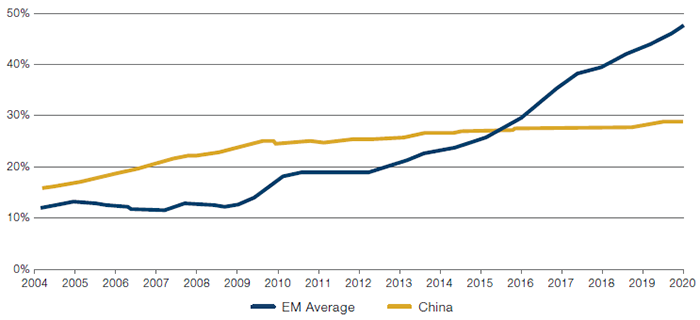
Source: EM Advisors Group; as of 21 October 2020.
Construction, which was stimulated in the first quarter and early in the second quarter by the credit injections, has already decelerated. Additionally, the demand for steel and cement continued to increase prices, while contributing to the accumulation of inventories (Figure 8). Note that in the previous peak in construction growth (highlighted within the oval), steel and cement purchases did not accelerate by as much as it has been the case in 2020. This leads us to believe that here has been a disproportionate increase in the demand of the commodities that are typically used in construction – one that is likely to reverse.
Figure 8. Chinese Growth – Construction, and Cement and Steel Purchases
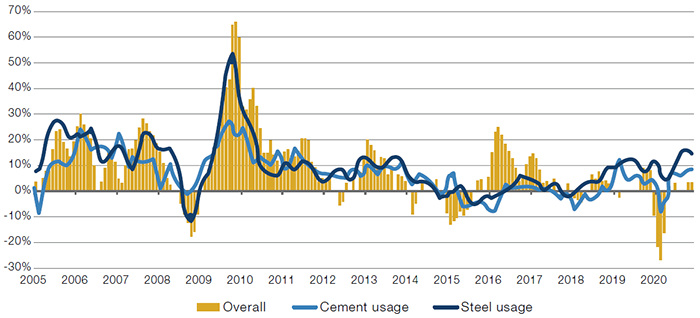
Source: EM Advisors Group; as of 18 November 2020.
This is further supported by the accumulation of iron ore and copper inventories since the beginning of the second half of 2020 (Figure 9) – precisely when EM countries might have been able to normalise the supply, which did suffer pandemic-driven limitations.
Figure 9. Copper and Iron Ore Inventories
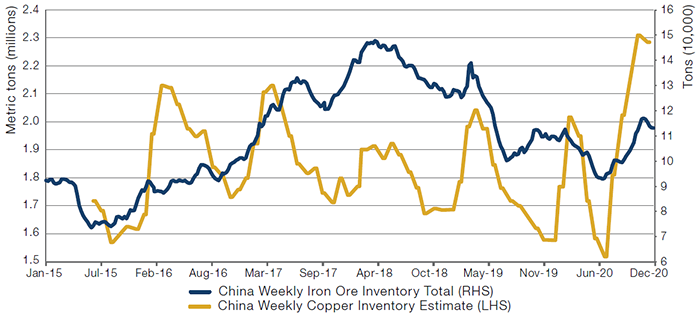
Source: Bloomberg; as of 14 December 2020.
It’s not just the metals that have seen price rises. Agricultural commodities, which are also important exports for several EM countries, have also seen significant increases in prices. The 2019 outbreak of African swine fever that killed roughly half of the stock of Chinese pigs drove a temporary spike in the demand for protein (particularly soybean), while the extreme drought affecting South America substantially reduced agricultural yields. These factors combined to cause a spike in soybean prices (Figure 10).
Figure 10. China Soybean Inventories and Soybean Price
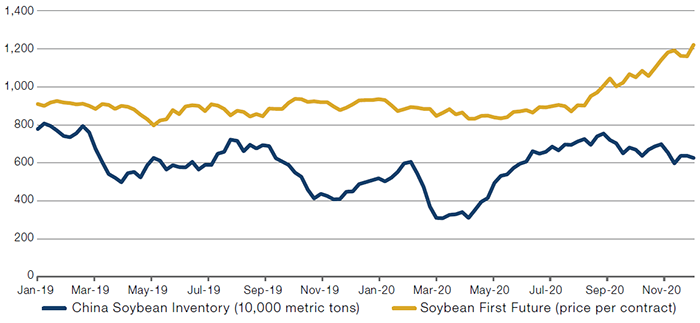
Source: Bloomberg; as of 14 December 2020.
Just as it is the case with metals, it appears that the demand for agricultural products is now going to slow down as the stock of pigs has been replenished, the inventories have been rebuilt, and rain seems to be normalising in South America just in time for the planting season.
Challenge 3: Pandemic Intensification Appears to Be Slowing Down DM Economies
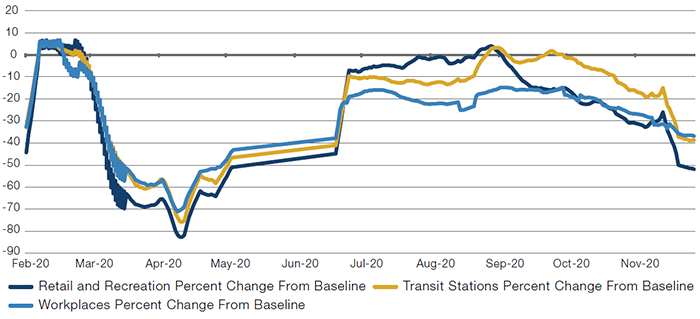
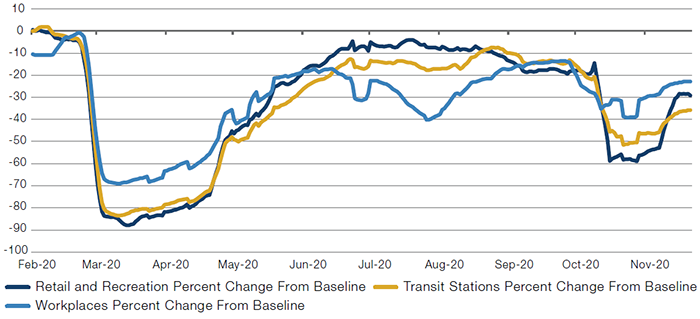
Figures 11-14 show the 7-day moving averages for the Google mobility measurements that cover retail, recreation, transit and workplaces, which are likely to be the most correlated of such measurements to economic activity. If anything, these measurements have deteriorated since the end of the third quarter across the largest developed markets in the western hemisphere. While this is not a significant influence for EM activity, it is unlikely to be supportive.
Figure 11. US Google Mobility Measurements – 7-Day Moving Average
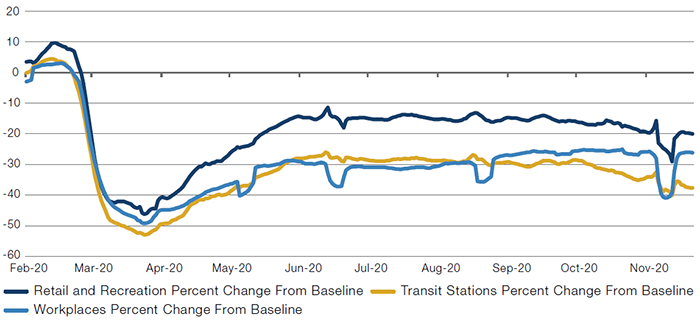
Source: Google; as of 11 December 2020.
Figure 12. German Google Mobility Measurements – 7-Day Moving Average
Source: Google; as of 11 December 2020.
Figure 13. France Google Mobility Measurements – 7-Day Moving Average
Source: Google; as of 11 December 2020.
Figure 14. UK Google Mobility Measurements – 7-Day Moving Average
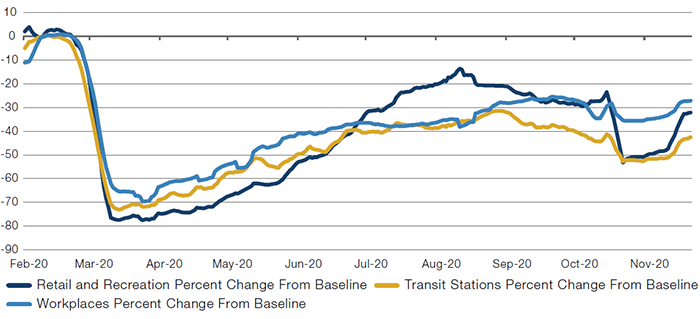
Source: Google; as of 11 December 2020.
Challenge 4: The US Dollar
We’ve noticed a number of sell-side analysts arguing that EM currencies are cheap versus the US dollar, with the expectation that valuation should start to revert to the mean. However, on a trade-weighted basis it is hard to argue that the dollar looks expensive relative to the last 30 years (Figure 15).
Meanwhile, the yuan is close to the most expensive levels ever recorded. Indeed, when we compare the yuan’s real exchange rate to the US dollar’s real exchange rate, the yuan has appreciated by roughly 42% between the end of 2005 and December 2020. During that period, the Chinese current account balance went from a high of around 10% of GDP in the mid-2000s to close to neutral just before the pandemic. The US current account imbalance decreased from a deficit of 6% to 2% over the same period.
Hence, in a world where EM currencies are highly correlated to the yuan, a view that expects EM currencies to substantially outperform the US dollar needs to believe that the yuan still has substantial upside versus the dollar in real terms. Secondly, we would need to assume that the inflation differential between China and EM versus the US will be either neutral or negative so that an investor can profit from going short the US dollar and long EM currencies through forwards or nominal instruments. Nevertheless, it is difficult to have a significant level of confidence in these two assumptions based on the evolution of the Chinese and US current accounts, and the current valuations.
In addition, if most EM countries with floating currency regimes need to generate inflation to improve their fiscal balances, the optimistic view on EM currency performance at least in nominal terms is further challenged.
Figure 15. USD and CNY Real Exchange Rate, and Current Accounts
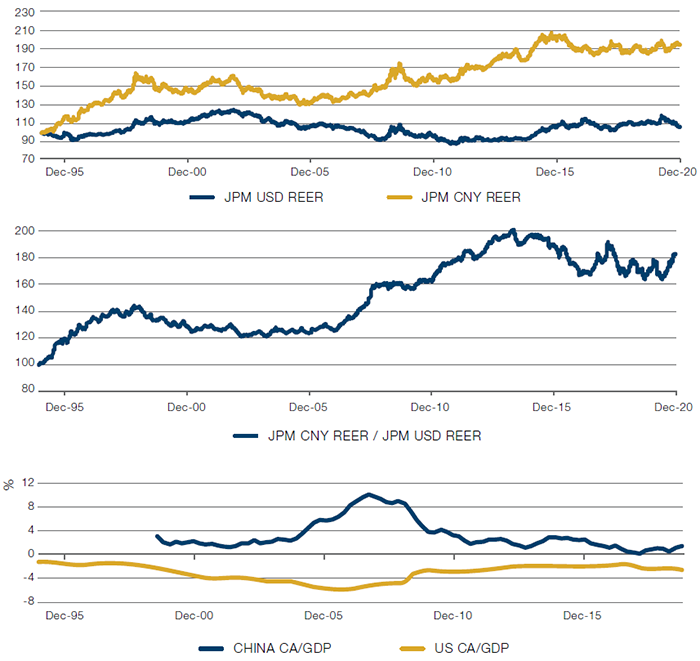
Source: Bloomberg; as of 15 December 2020. Top and middle charts have been normalised as of 4 January 1994.
On the hard currency front, investors might be tempted by the apparent attractiveness in spreads. The EMBIG, with a BBB- rating, offers a spread of 358 basis points over Libor. Performing a detailed analysis on an apples-to-apples basis between DM and EM credit is quite complicated and would require so many considerations that it would be difficult to sum up in this article.
However, a very simple way of comparing the attractiveness of EM sovereign credit to that of DM credit is by looking at 5-year spreads on credit default swaps (‘CDS’) for EM countries that are either investment grade rated or that are likely to be able to service their debt without much stress over the next three years at least. As Figure 16 shows, on average, this sample of EM countries (that in certain cases are not even rated as investment grade) only offer on average a 2 bps advantage over US IG corporate credit, which theoretically is more likely to get support from the Federal Reserve than EM issuers.
Figure 16. Five-Year Selected EM CDS Spreads and US IG CDX
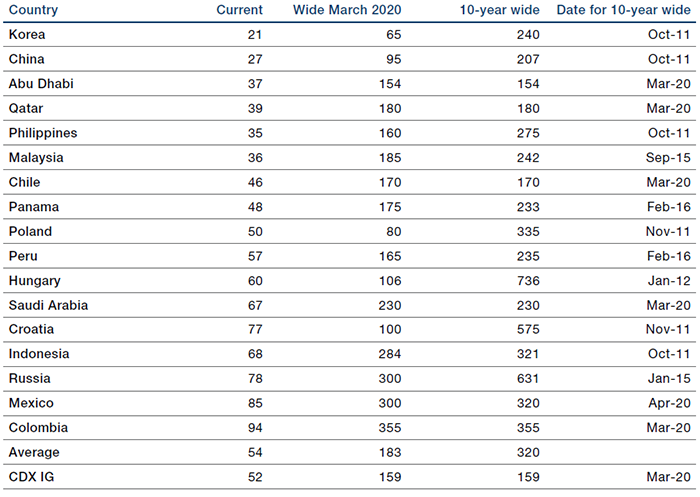
Source: Bloomberg; as of 17 December 2020.
Challenge 5: Positioning
Figure 17 shows how the sensitivity of the US IG corporate fixed income and EM US dollar-denominated fixed income universes have increased over time. We believe that this is due to the growth in debt stocks and the increase in average duration. For EM bonds, risk increased by more than 11 times compared with late 2011. Indeed, 46% of this risk accumulation occurred in the last two years and it is likely to continue to accelerate given the issuance needs from EM countries.
Figure 17. Investment Grade Sensitivity to Changes in Rates – US Versus EM
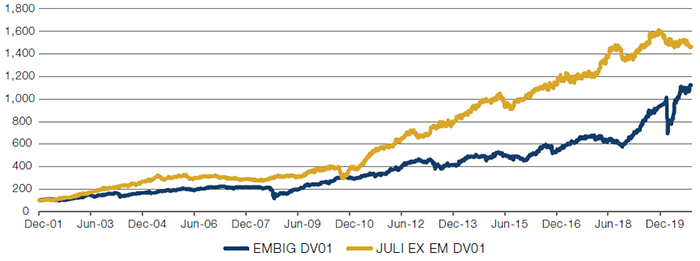
Source: Bloomberg; as of 23 November 2020.
Given the fundamentals, short-term cyclical considerations and extreme valuations discussed so far, we cannot but wonder if market participants are going to be able to tolerate market stresses considering this exponential increase in the accumulation of risk.
Despite the increased risk, positioning analysis on EM fixed income mutual funds shows that the beta implied in the returns for the EM funds versus the benchmarks did not fall meaningfully if at all during the March selloff, and increased thereafter (Figures 18-19). To us, this indicates that managers, and we suspect investors in general, actually doubled down rather than cutting risk during the March correction.
Figure 18. Main EM Total Return and EM Funds Versus Benchmark Returns
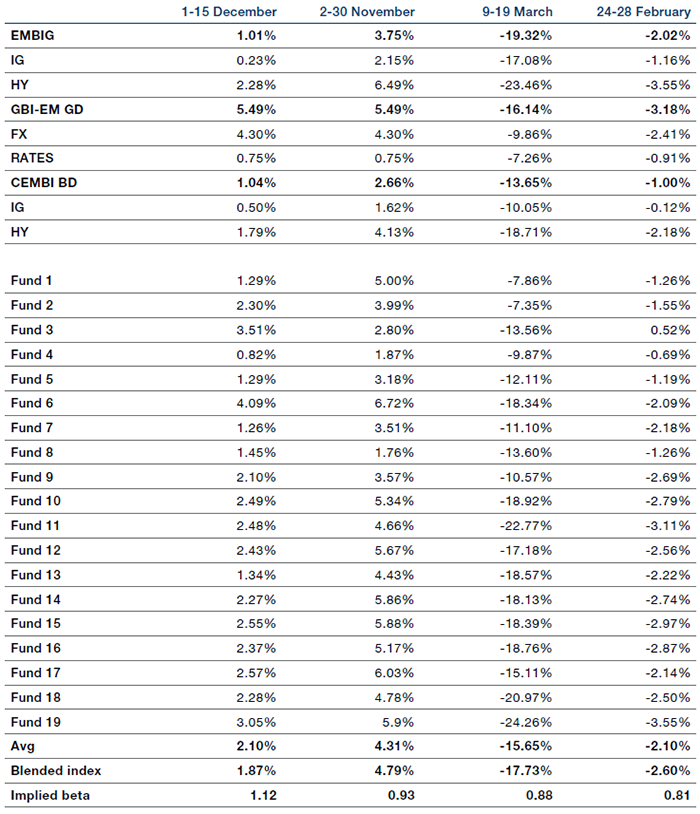
Source: Bloomberg; as of 15 December 2020.
Man GLG has selected the largest 20 daily priced Emerging Markets Debt Total Return funds as identified by the eVestment database Emerging Markets Fixed Income – Blended Currency universe. Only constituents with USD1 billion or more in the strategy have been included. This data being represented is not the complete universe of this asset class and investment decisions should not be made based upon this data. Mutual funds may be subject to additional fees and restrictions, therefore this data may not be representative of Man GLG’s products. The indices shown are the JP Morgan Emerging Market Bond Index Global, Government Bond Index-Emerging Markets Global Diversified, and Emerging Market Corporate Bond Broad Diversified Index. The Blend is comprised of 50% JPM EMBIG and 50% GBI EM Global Div Indices The ETFs included are the following: HC: IShares JPM EMBI CORE, iShares, JPM EMBI Core (Int’l), PowerShares DB EM Equal-Weight),Vanguard Barclays EM USD Government, Van Eck BAML EM HY Corp. LC: VanEck JPM GBI-EM Local, iShares JOPM GBI-EM Local UCITS, iShares JOPM GBI-EM Local UCITS 40-act, iShares Barclays EM Local. The ‘implied beta’ is the beta of the average of the above funds versus that of the blended index.
Figure 19. Main EM Hard Currency Sovereign Benchmarked Funds Versus EMBIG Global Index Returns
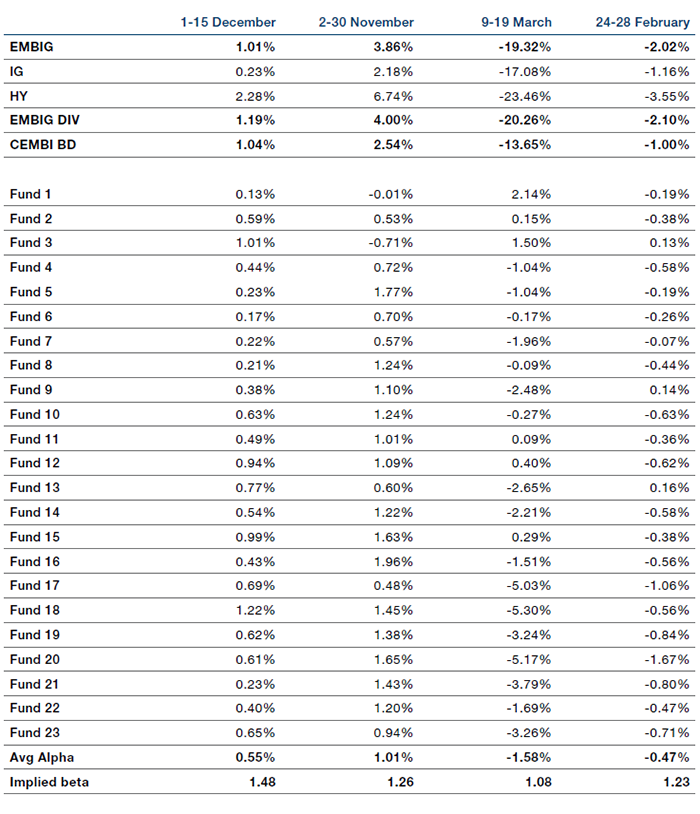
Source: Bloomberg; as of 15 December 2020.
Man GLG has selected the largest 24 daily priced Emerging Markets Debt Hard Currency funds as identified by the eVestment database Emerging Markets Fixed Income – Blended Currency universe. Only constituents with USD1 billion or more in the strategy have been included. This data being represented is not the complete universe of this asset class and investment decisions should not be made based upon this data. Mutual funds may be subject to additional fees and restrictions, therefore this data may not be representative of Man GLG’s products. The indices shown are the JP Morgan Emerging Market Bond Index Global, Emerging Market Bond Index Global Diversified, and the Emerging Market Corporate Bond Broad Diversified Index. The Blend is comprised of 50% JPM EMBIG and 50% GBI EM Global Div Indices. The ‘implied beta’ is the beta of the average of the above funds versus that of the blended index.
Finally, we cannot avoid mentioning that our monitors of currency positioning show that short US dollar exposures are very extended. The yellow line in Figure 20 shows the 6-week rolling beta of publicly traded CTAs versus the EM local bond index (‘GBI-EMGD’), while the blue line shows the cumulative return for that benchmark. On average, CTAs spent most of 2019 neutral or short EM currencies, while the EM local bond index accumulated positive returns. CTAs finally moved to a long EM currency position (peak beta was 1.35 on 3 June 2020), experiencing some losses initially in the March selloff. They then went short EM currencies as the EM local bond index recovered. As Figure 20 shows, CTAs only began to go long EM local beta from mid-August on and reached their peak exposure in early October, which they have since maintained. We believe that part of the post-US election rally has been a consequence of short covering by those market participants that had taken the other side of these CTA trades.
Figure 20. Six-Week CTA Rolling Beta to GBI-EMGD Index Returns
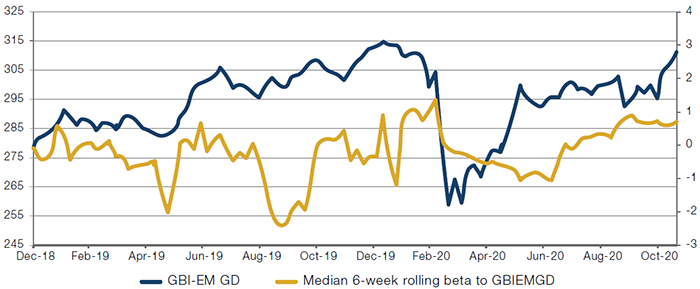
Source: Bloomberg; as of 11 December 2020.
The fact that the beta has not increased further leads us to assume that CTAs are probably close to their maximum risk tolerance levels. As such, we believe that we would now need either fundamentals or valuations to be the drivers of currency performance on the margin – and as we have discussed, we believe that neither are supportive enough to justify significant positive performance going forward.
Conclusion
As news of an effective vaccine have rekindled investor optimism and the hunt for riskier investments, emerging markets have seen a comeback as an asset class. However, we believe that it is prudent to remain cautious on emerging markets for five reasons.
First, we are anxious about the rising overall debt burdens in emerging markets. Secondly, we do not share the market’s expectation that the Chinese credit impulse will continue to ride the rebound of emerging markets. Third, conditions across the largest developed markets in the western hemisphere have deteriorated since the end of the third quarter. While this is not a significant influence for EM activity directly, it is unlikely to be supportive. Fourth, we see very few reasons for continued EM currency appreciation versus the dollar. All these, combined with an investor base which has loaded up on risk, makes us believe that it is prudent to remain profoundly cautious on emerging markets.
You are now leaving Man Group’s website
You are leaving Man Group’s website and entering a third-party website that is not controlled, maintained, or monitored by Man Group. Man Group is not responsible for the content or availability of the third-party website. By leaving Man Group’s website, you will be subject to the third-party website’s terms, policies and/or notices, including those related to privacy and security, as applicable.