1. Introduction
Structured or unstructured recorded information, or ‘data’, is a key input for any investment strategy. A passive, index-tracking strategy requires an up-to-date list of index constituents. An active strategy seeks to obtain and analyse timely insights in order to outperform.
Over the past decades, the range of data available to the investment management industry has exploded. In addition to the historic giants such as Bloomberg, Factset and Refinitiv (formerly ThomsonReuters), a smörgåsbord of smaller data providers has emerged. Large companies are increasingly starting to view their data as an asset, not an expense: this has led to them considering ways to monetise it. To help investors prioritise, intermediaries like Eagle Alpha have sprung up to provide easy access to a wide range of data vendors and facilitate comparison by reporting a host of comparative statistics.
The roots for this data revolution can be traced back to at least the 1980s. Since then, we have seen exponential growth in computing power and dwindling storage costs, which led to internet and smart-phone usage becoming commonplace and leaving an electronic trail for many economic transactions (e.g. online purchases) or economic intentions (Googling for the latest refinancing rates on mortgages). Indeed, high-resolution data sensors, like satellites or cameras, have featured prominently in the tales or legends of today’s ‘data gold rush’. Think of the overused example of counting cars outside a shop to proxy the popularity of a retailer.
However, the reality of using new or ‘alternative’ data is less glamorous than the way it is sometimes portrayed, and involves hard work to sift through many datasets of varying quality and relevance. In this article, we attempt to shed some light on this new data landscape: how does alternative data differ from more traditional data? Who uses it? What are its benefits? What should we be mindful of? In short: what is the data on data?
2. The Data Landscape
We first sketch the rich data landscape and how it has evolved over time.
2.1. Traditional Versus Alternative Data
Together with having an instrument to buy or sell, and the technology to transact, data is one of the three requirements of any investment strategy. Quant managers like Man AHL or Man Numeric have been using data systematically since the 1980s, finding repeatable patterns in price, volume or fundamental data to predict asset prices – nothing new here.
However, over the last decade or so, a new category of datasets, commonly described as ‘alternative’ has emerged. Figure 1 outlines some of the differences between traditional datasets and alternative datasets.
Figure 1. Comparison of Traditional and Alternative Datasets
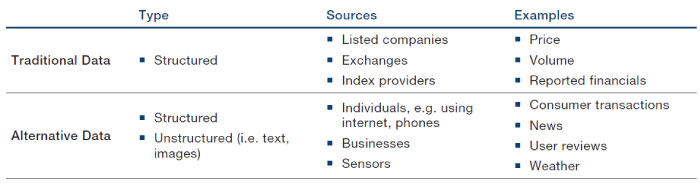
Source: Man Group, Eagle Alpha.
The business of providing traditional data has historically been dominated by a few large players like Bloomberg, Factset and Refinitiv. However, the distribution of alternative datasets is fragmented across a wide number of providers, not necessarily all finance-focused. This has led to the emergence of a dedicated ecosystem of middle-men, including Eagle Alpha, which acts as an intermediary between data vendors and potential users of data.
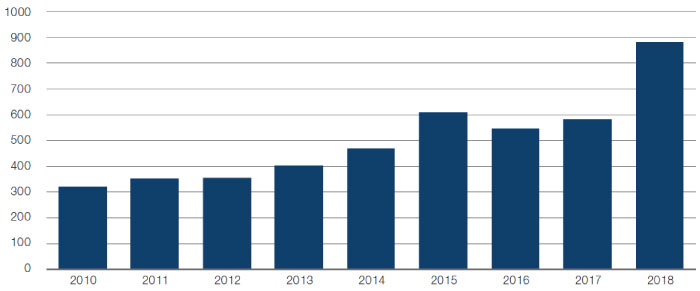
2.2. The Explosion of Alternative Data
The variety and number of alternative datasets available to the investment management industry has exploded over the past five years. This is illustrated in Figure 2, which shows the number of datasets on the Eagle Alpha platform.
Figure 2. Number of Datasets Over Time
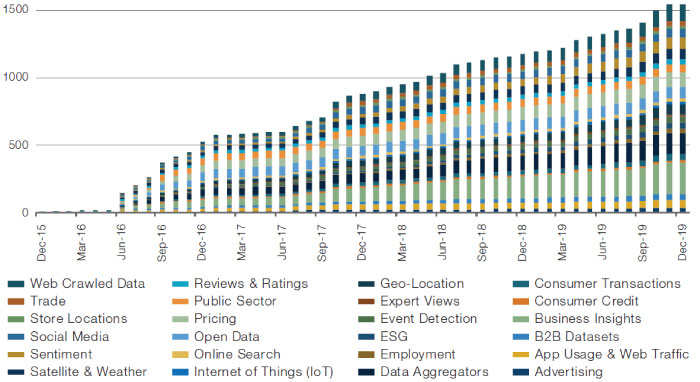
Source: Eagle Alpha; As of December 2019. Datasets are split into Eagle Alpha categories1.
The data comes in many forms, which Eagle Alpha breaks down into 24 categories as shown in Figure 2. Another useful way to split the universe is by who generates the data:
- Individuals: social media, consumer transactions, reviews, ratings, online search;
- Sensors: satellites, geo-location, and weather updates;
- Businesses: business insights, store locations.
2.3. Everyone Is Doing It
Not only has the supply of data exploded, but the interest in (or demand for) data has also surged. For example, one-on-one vendor meetings at alternative data-focused conferences has increased markedly, particularly in New York.2 Figure 3 shows the number of meetings at conferences held by Eagle Alpha has been rising over time. This reflects the increased focus by investment management firms of varying types: quant managers obviously, but also discretionary ones, as well as private equity and real-estate firms. At the time of writing, government agencies and corporates are also increasingly exploring alternative data sources to obtain timely insights around Covid-19 and its social and economic impact. Often, these efforts lead to the creation of dedicated data teams responsible for all things data-related, from strategy and sourcing to on-boarding and maintenance.
Figure 3. One-on-One Meetings at Eagle Alpha Conferences
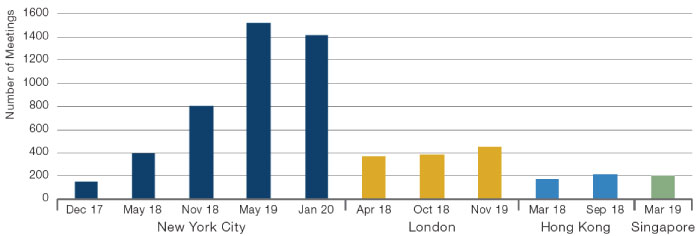
Source: Eagle Alpha; as of January 2020.
2. about="" alternative="" data="" exciting="" is="" what="">
3. What Is Exciting About Alternative Data?
Alternative data, through its combination of breadth and specificity (and sometimes scarcity), can prove a very useful complement for forecasting asset prices. This holds for both quant and discretionary managers, and applies to both ‘micro’ assets (such as listed stocks), or ‘macro’ ones (such as bonds, currencies or global commodities).
3.1. Early Measures for Company Fundamentals
The value of a company depends on its ability to generate cash and pay this out (now or in the future) to stockholders. The most precise information on a company’s ability to generate cash typically comes from the quarterly and annual reports, which summarises the state of affairs based on actual data, in a regulated format, and reviewed by accountants. Unsurprisingly, the market pays close attention to official accounting information, and stock prices can jump at the moment of the release.
Alternative data holds the promise to provide an early view into a company’s key fundamentals prior to the official release, and so may provide investors a datapoint that is complementary to the more traditionally used analyst consensus forecasts. For instance, several data providers offer credit card transaction data that show how much a company is selling. In some cases, such as for a retail store chain, these can be expected to be a rather accurate gauge of sales, a key company fundamental. Lacking such data, one can resort to estimating footfall (by counting cars outside shops using satellite imagery) to get a more crude proxy for traffic and volume. An even cruder approach may be simply to check on Google Trends whether searches for a company’s products are on the rise.
Figure 4 illustrates how traditional and alternative datasets might relate to a simple, yet key, reported metric – revenues – which can be decomposed into: volume x price.
Figure 4. Using Traditional and Alternative Datasets to Calculate Revenues
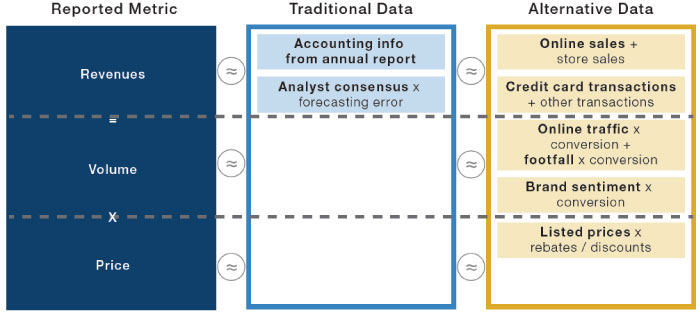
Source: Man Group, Eagle Alpha. For Illustrative purposes only. Note: specific datasets highlighted in bold.
This simplistic diagram highlights a few features of alternative data:
- Compared to traditional data, there is a wide range of alternative datasets available, which tend to be very specific and granular;
- As a result, their use is more prevalent for ‘micro’ assets such as stocks, where specific economic drivers of profitability can be assessed;
- Their usefulness relies on the ability to directly, or indirectly, estimate with statistical significance an important metric, meaning that alternative data is particularly useful for industries where a few key metrics drive most of the marginal profitability (e.g. credit card information for retailers);
- Whereas companies report profit-and-loss metrics and associated KPIs on a quarterly or semi-annual basis with a lag, alternative data can be available on a daily basis, leading to a de facto trade-off between accuracy and frequency.
Figure 5 lists the most expensive data types, as assessed by Eagle Alpha3, with credit and consumer transactions standing out. This rhymes well with anecdotal evidence that these datasets are very predictive for the stock price of, for example, retailers. Indeed, the price can be more than USD 500,000 per firm, per year for a full package.
Figure 5. Most Expensive Data Types
| 1 | Credit |
| 2 | Consumer transaction |
| 3 | Geo-location |
| 4 | App usage & web traffic |
| 5 | B2B datasets |
| 6 | Pricing |
| 7 | ESG |
| 8 | Patent data |
| 9 | Employment |
| 10 | Event detection |
Source: Eagle Alpha
3.2. Early Measures for Commodity Fundamentals
While the application and usage of alternative data is prevalent for micro assets such as stocks, it can also be relevant for macro assets such bonds, currencies and commodities.
Let’s take corn as an example. Much of the price fluctuation is driven by supply considerations, as demand for corn is relatively stable and price inelastic.4 A key traditional data source for corn and other agricultural products is the monthly World Agricultural Supply and Demand Estimates (‘WASDE’) report provided by the US government. While it is impossible (and illegal) to know exactly the market-moving WASDE numbers ahead of time, a laborious process of manually inspecting a large sample of crops fields on the ground can provide a timely signal. Somewhat less precise, but much more feasible, is analysing satellite images that pick up the health of the crop from the type of light emitted by the plants. More crude still, is keeping track of weather conditions and from that, inferring if the crop is likely to be in a good or bad state.
Figure 6. Using Traditional and Alternative Datasets to Determine Corn Production
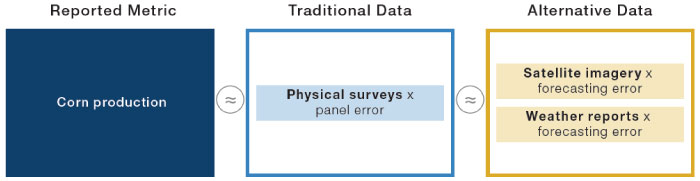
Source: Man Group, Eagle Alpha. For illustrative purposes only.
3.3. Ten Sample Alternative Data Insights
The following examples present an abstract and brief synopsis of 10 recent datasets. We note here that this is just a small sample and serves to illustrate the ingenuity of data providers to get an early measurement for a relevant metric such as product sales, exports, etc. For each example, we mention the early metric and from what data the early insight is distilled. Additional use cases can be found in a recent whitepaper published by Eagle Alpha.5
- Retail store foot traffic from mobile phone locations: Measure foot traffic by tracking real-time locations from mobile phones and matching them with point-of-interest data related to retail stores locations;
- Product sales estimate from email receipts: Aggregated and anonymised email-receipt data used to extract information related to product purchasers, deliveries and return items. This data offers insights into product and brand purchases, including same-store sales;
- Booking activity from web traffic and clickstream data: Measure hotel, apartment, flight and restaurant bookings from tracking clickstream data such as bookings websites and scraping comments from messages such as “10 people booked this property in the last 48 hours”;
- New product sentiment from social media and web traffic: Determined by scanning social-media posts and web articles and applying Natural Language Processing (‘NLP’) techniques;
- Export activity from analysing bills of lading data: Supply-chain intelligence by monitoring trade flows using anonymised bills of lading from government agencies to map supply-chain data by industry, region and company;
- Pharmaceutical pipeline from clinical research transitions: Using data derived from multiple sources, including clinical patents and regulatory history of drugs, to provide a likelihood-of-success metric;
- ESG scores from combining employment engagement ESG factor scores and company-diversity data: Aggregating various sources lead to an all-rounded environmental, social and governance (‘ESG’) metric for a company;
- Industrial activity from satellite images: Satellite images are processed to identify signs of industrial activity such as geographic changes, new construction objects or inventory accumulation;
- Labour market activity from online job listings: Tracking online job listing and company reviews can provide insights into hiring activity and employee churn;
- Company financial health measure from crowdsourced professional views: Using data sourced from commercial credit managers responsible for establishing terms of credit to customers. Trade credit data related to accounts payables can help represent the source of debt financing for a business.
4. Putting Alternative Data Into Practice
In this section, we discuss the operational setup (and mindset) needed to unlock the potential of alternative data. We also list 10 things to be mindful of, in our view, when exploring alternative data.
4.1. Operational Setup
As institutions embrace the data revolution, many are finding that their existing workforce, as well as their organisational setup, is not very well suited for it. It can be time-consuming to find, explore and put into practice a single dataset. Not every dataset considered proves to be useful upon closer inspection. And, in some cases, the shelf life of a new dataset could be finite e.g. because the data is mostly relevant for a specific environment, like the subprime mortgage loan defaults in 2007-2009 or the spread of Covid-19 in 2020.
The substantial effort required to analyse alternative data also explains the increased traction of data intermediaries (or data brokers), like Eagle Alpha, who do a first scan of a data providers and provide a good starting set of diagnostics that can be used to compare across thousands of datasets.
Equipped with a good flow of alternative data ideas, it is important to have the right processes in place, in our view. This involves establishing relevant data-governance frameworks, implementing appropriate infrastructure and tools, and managing the data ingestion and evaluation process.
Firms are increasingly finding that they need to employ new (or refocus existing) employees to manage the process from scouting data all the way up to monitoring data once embedded into the investment management process. This has led to an increase in data-related job postings and data spend. Data roles related to Chief Data Officers (‘CDOs’) or Heads of Data Science & Analytics are becoming more prevalent and play a strategic role in introducing innovative, big-data technologies, analytics and data science to boost investment processes.
In Figure 7, we depict the continued trend in open vacancies for roles related to data science and big data in the US, per analysis done by Burning Glass Technologies.
Figure 7. Average Daily Big-Data Job Postings (US)
Source: Burning Glass Technologies; as of 2018.
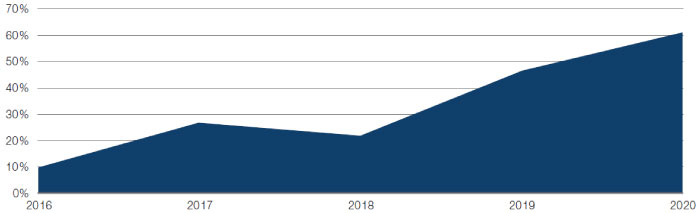
The number of alternative data FTEs has grown by about 450% in last five years, according to AlternativeData.org. This trend has resulted in an increase in buy-side spend on alternative data (Figure 8).
Figure 8. Total Buy-Side Spend on Alternative Data
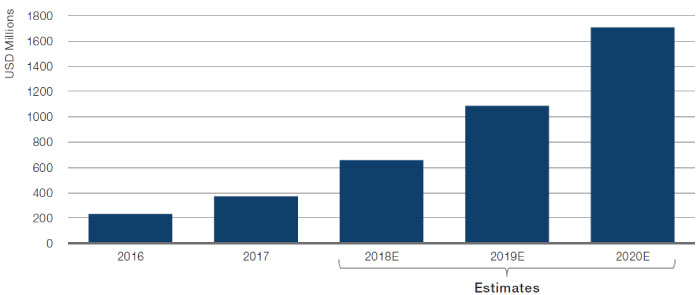
Source: Alternativedata.org; as of end-2017.
4.2. What to Be Mindful of When Exploring Alternative Data
While alternative data could hold great promise, we believe there are challenges to overcome in order to unlock the potential. The number of alternative data providers continues to grow exponentially, which has led to varying quality of data offered by the providers. Some providers are well-established and have appropriate governance, data science and technology teams. Other vendors can be as limited to two employees in a start-up. Many of these start-up providers were born in an era of data ubiquity and, at times, can be in the market place to be part of the ‘gold-rush’, even if that means cutting corners to deliver data to clients. Data takes various forms and shapes: it is not born ‘good’ and it is up to the data buyer to scrutinise the data to make the best use of it.
These are some of aspects of data to be mindful of, in our view (in no particular order):
1. Methodology: For data to be useful, it needs to be clean, consistent, sourced and processed appropriately. Often, data is provided after some processing steps are done. Limited awareness of the raw data exposes the user to the risk of incorrect processing and a false representation of the predictive power;
2. Data Quality: Data often requires a thorough cleansing to correct for inconsistencies. This is particularly true for unstructured data. Ideally, firms should have the ability to process different formats of raw data from different sources. Vendors are now providing multiple delivery methods for firms to access their raw data. Most common methods of data extraction include Application Program Interface (‘API’), data aggregator platforms and File Transfer Protocol (‘FTP’, Figure 9). When assessing quality, specific attention should include dealing with: categorical variables; multiple data types; negative age; and irregular missing observations.
Figure 9. Delivery Methods of Available Datasets
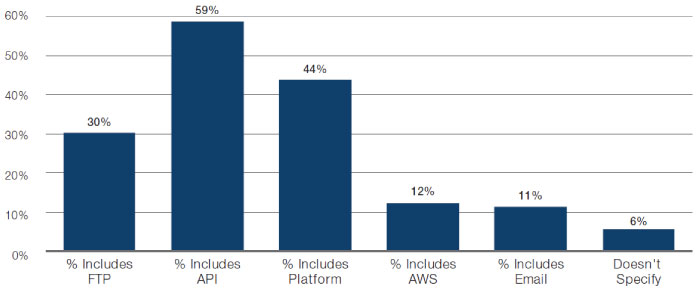
Source: Eagle Alpha; between 2016-2020.
3. Mapping: Firms should ensure that they have a robust method to verify vendor mappings. The growth in datasets related to consumer spending and reviews have resulted in primary identifiers being company names or merchants. This can prove to be challenging to map it precisely to traded securities. Figure 10 shows the proportion of datasets mapped to a specific identifier, according to Eagle Alpha. A higher proportion of datasets are mapped to company names.
Figure 10. Mapped Tickers
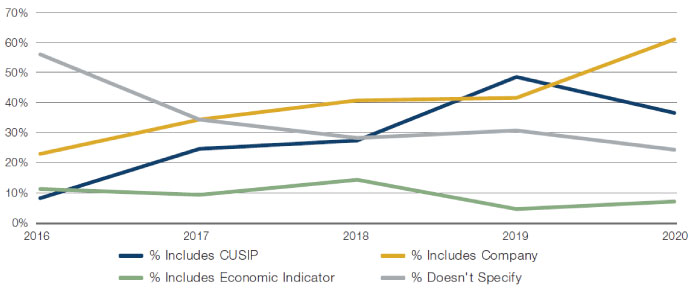
Source: Eagle Alpha; between 2016-2020.
4. History: As of the end of 2019, less than half of datasets have a history that exceeds seven years6, although intraday data with a 3- to 5-year history may be sufficient for a backtest. As a rule of thumb, for a backtest Sharpe ratio to be statistically significant at the 95% confidence level, one needs an annualised value of 2/√(years). That boils down to an annualised Sharpe ratio of 0.76 with seven years of data, and a much higher bar of a 1.41 annualised Sharpe ratio with only two years of historical data.7
Figure 11. History and Frequency of Datasets
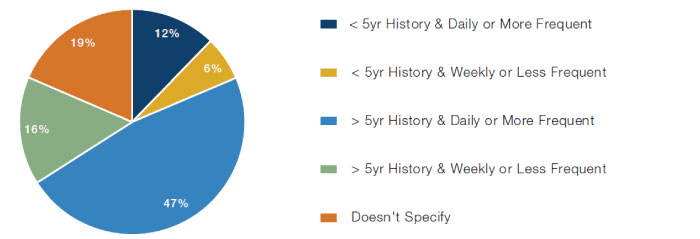
Source: Eagle Alpha; as of 2019.
5. Data lag: Data with a long lag can affect predictability. An example may arise from slow processing on the vendor’s part, or the requirement for a data provider to impose a lag in order to ensure compliance with market abuse regulations and avoid disseminating insider information.
6. Data assessment: The dataset should offer a genuine indication of predictability. Data can be backfilled or backdated, while one would need point-in-time data to run an unbiased historical backtest. Common pitfalls during the data assessment stage include survivorship bias, data mining fallacies and mistaking contemporaneous correlation for predictably. An example of this is sentiment analysis of text data provided by a vendor. It is important to understand the NLP analysis behind the scoring. Where possible, perform the analysis yourself.
Figure 12. Percentage of Vendors Providing Alpha Use Case
Source: Eagle Alpha; as of 28 February 2020.
7. Scope: Often, datasets focus on a subset, and one has to establish if it is representative for the case at hand. For example, do credit card transactions accurately represent total transactions, which would include items paid for by cash? Or does data for the US provide a good proxy for a global firm’s sales? Indeed, a quarter of datasets have a US regional focus (Figure 13). As such, ignoring the regional focus represented in a dataset could lead to a geographical bias.
Figure 13. Regional Focus

Source: Eagle Alpha; between 2016 and 2020.
8. Stationarity: An increasing number of articles may simply be because of increased coverage of news sources, rather than an increase of new articles per se. A user’s ability to correct for non-stationarity will depend on whether the data provider provides enough details on the changing coverage and panel sizes. It is important to account for changes in coverage and panel sizes in your evaluation, in our view.
9. Governance: Misuse of third-party data has been brought into the spotlight recently and the potential commercial benefit gained from this information could leave a business exposed to litigation. Thorough due diligence on the source of the data should be done to ensure any sensitive data is cleaned before use, and that it complies with data protection, copyright and other appropriate regulations. Recently, a new alternative data council has been set up as part of the Financial Information Services Association (‘FISD’) to engage with the alternative data community and establish best practices and standards for the delivery of alternative data to the investment industry.
10. Crowding: The increase in interest around data has resulted in data typically offered to a variety of industry peers. As such, one has to be mindful of the possibility of a crowding effect and diminished predictive power (alpha decay).
5. Conclusion
The increasing variety and quantity of alternative data holds great promise for investment managers looking for an edge.
However, alternative data is not a silver bullet. While some data – such as credit card data – has proven to be very valuable and complementary to more traditional price data and accounting information, we believe there are challenges to overcome in order to unlock the full potential of alternative data, including varying quality and relevance of data offered by the providers.
1. Certain datasets can be tagged to multiple categories.
2. The reduction in one-on-one meetings in NYC from May 2019 to January 2020 is because at the later event, there were five concurrent group presentations competing for time.
3. This is determined using the price that vendors have disclosed on Eagle Alpha’s platform and blended with transacted data observed by Eagle Alpha in the market.
4. This is, admittedly, somewhat of a simplification, as e.g. US corn prices can be impacted by fluctuations in foreign demand due to supply shocks abroad.
5. Eagle Alpha recently published a white paper with 100 case studies related to the use of alternative data.
6. Based on the c. 1,500 datasets covered by Eagle Alpha.
7. The rule of thumb is that one needs a t-stat of 2, and that the t-stat is approximately equal to the annualised Sharpe ratio / √(years), where the idea is that the volatility of returns decreases with the square-root of time.
You are now leaving Man Group’s website
You are leaving Man Group’s website and entering a third-party website that is not controlled, maintained, or monitored by Man Group. Man Group is not responsible for the content or availability of the third-party website. By leaving Man Group’s website, you will be subject to the third-party website’s terms, policies and/or notices, including those related to privacy and security, as applicable.