Introduction
We all have become experts in the science of climate change: with no-one any longer doubting the seriousness or immediacy of global heating, we are now increasingly delving into the details of how to address the greatest threat our species has faced. To do so, we need to speak the language of climate science. In this paper, we will provide a guide to climate modelling and the various paths to net zero that are currently envisaged by climate scientists. While no document this brief can hope to attain anything like completeness when it comes to the intricacy of climate science, we hope that readers will find much here to engage and illuminate.
Let us begin with the basics. A direct line can be drawn from weather forecasts to climate models. Weather forecasters use data and weather models to establish likely atmospheric conditions. The forecast takes into account humidity, temperature, air pressure, wind speed and direction, as well as cloud cover and other natural and manmade elements that could impact the hour-by-hour weather. These forecasts look out over a period of 10 days to two weeks and ascertain with both reasonable certainty and geographic specificity the likely pattern of weather in any one location. These individual localised forecasts are then combined to give a picture of the likely weather in a region and country.
Climate models essentially employ a similar process to weather models, although whereas weather looks for short-term patterns with a high degree of granularity, climate models analyse broader data over much longer time periods to establish average conditions over decades and centuries. Climate models also include processes that may not influence short term fluctuations in weather but are contributing to longer term climate change. These include ocean currents and melting glaciers, as well as the impact of human activity. Climate models take many thousands, even hundreds of thousands, of data points and run them through sophisticated iterations to simulate the impact on complex earth systems.
Chapter 1: The Science of Global Heating
Global heating is the long-term heating of Earth’s climate system observed since the pre-industrial period (before 1850) due to human activity, primarily the burning of fossil fuels, which increases heat-trapping greenhouse gas levels in Earth’s atmosphere. Global heating (or warming) is frequently used interchangeably with the term climate change, though the latter refers to both human- and naturally produced warming and the impact it has on our planet. It is most commonly measured as the average increase in Earth’s global surface temperature.
Figure 1. The Greenhouse Effect
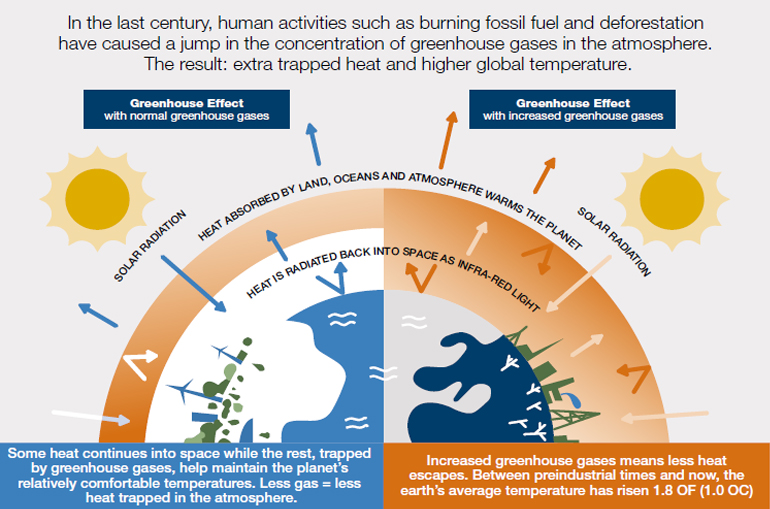
Source: Natural Resources Defence Counsel; as of 21 October 2021.
Earth’s greenhouse gases trap heat in the atmosphere and consequently increase global temperatures. The main greenhouse gases emitted by human activity are carbon dioxide (CO2), methane (CH4), and nitrous oxide (N20). Annual emissions of these three substances have respectively risen, as measured in billions of tons, from 14.8, 5.3, and 2.2 in 1970 to 36.1, 8.0, and 3.2 by 2014. CO2 is the least potent but nonetheless the most important greenhouse gas. It is released in massive and rising volume from the burning of fossil fuels (petrol, natural gas, coal) and land use (deforestation, slash-andburn agriculture). More potent, but released in overall volume that is less impactful, is CH4, which is a by-product of livestock digestion, fossil fuel extraction, and the decay of agricultural waste. This is followed by N20, which is released by industrial activity and industrial agriculture. Methane is more potent immediately after it is released, but it decays faster (over one or two decades) than carbon dioxide (which takes around a century).
There are other harmful gases that contribute to global heating, including fluorinated gases (F-gases) including hydrofluorocarbons, perfluorocarbons, sulphur hexafluoride and nitrogen trifluoride. These are powerful synthetic greenhouse gases that are emitted from a variety of industrial processes.
Greenhouse gases have different chemical properties and are removed from the atmosphere, over time, by different processes. Carbon dioxide, for example, is absorbed by so-called carbon sinks such as plants, soil, and the ocean. Fluorinated gases are destroyed only by sunlight in the far upper atmosphere.
How much any one greenhouse gas influences global warming depends on three key factors. The first is how much of it exists in the atmosphere. Concentrations are measured in parts per million (ppm), parts per billion (ppb), or parts per trillion (ppt); 1 ppm for a given gas means, for example, that there is one molecule of that gas in every 1 million molecules of air. The second is its lifetime—how long it remains in the atmosphere. The third is how effective it is at trapping heat. This is referred to as its global warming potential (‘GWP’), and is a measure of the total energy that a gas absorbs over a given period of time (usually 100 years) relative to the emissions of 1 ton of carbon dioxide.
To establish patterns of climate change, scientists look at what is known as radiative forcing. There are natural forcings – changes in the sun’s energy output, the Earth’s orbital cycle, volcanic eruptions – and, increasingly, there are human-caused or anthropogenic forcings – the release of gasses that increase the amount of energy within the Earth system. Each greenhouse gas has its own radiative forcing and the combination of these forcings is largely responsible for global heating. Since the Industrial Revolution, radiative forcing has increased dramatically, a reflection of the impact of anthropogenic activity.
Figure 2. Radiative Forcings
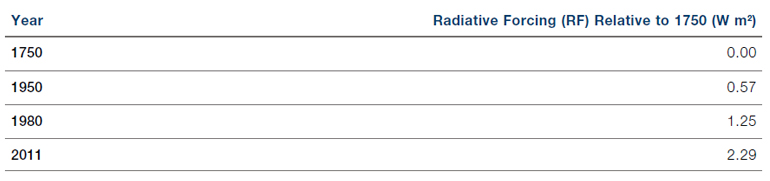
Source: National Oceanic and Atmospheric Administration; as of 21 October 2021.
Figure 3 shows the impact of different forcings on overall climate and the level of confidence with which each of these impacts can be stated.
Figure 3. Relative Forcings by Emissions and Drivers
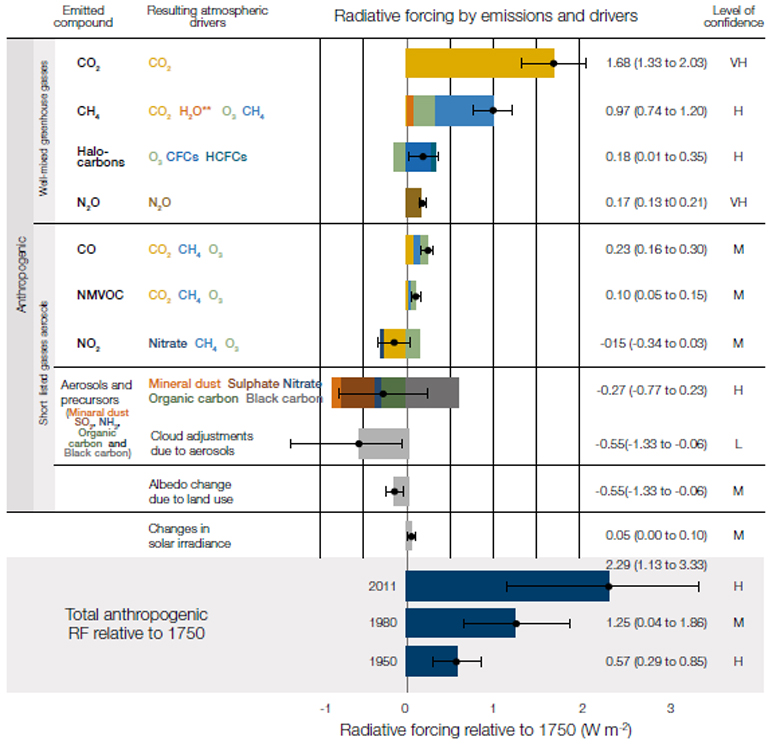
Source: IPCC; as of 21 October 2021, data range between 1750 and 2011.
Chapter 2: Building Climate Models
It should be pointed out here that climate models are not a precise science; they do not show facts but rather indicate potential directions for climate. The further into the future they look, the less certain they are. This uncertainty sits behind many of the misapprehensions and issues surrounding climate models. If we understand them properly it is as indicators of change and potential paths of travel, which, in combination with other forecasting models and research, will give a range of possible outcomes for global temperatures and other climatological changes.
When building models climate scientists generally employ the somewhat archaic programming code Fortran. A single climate model can fill 18,000 pages of printed text. There are more than 40 global climate models currently in operation and they work by separating the Earth’s surface into a 2- or 3-dimensional grid of cells, usually between 600km and 100km in longitude and latitude (although, due to the curvature of the Earth, these will be smaller at the poles and larger at the equator). These grids are layered both horizontally and vertically across the surface of the Earth, down to the depths of the oceans and into the atmosphere.
Figure 4. Climate Model Grid
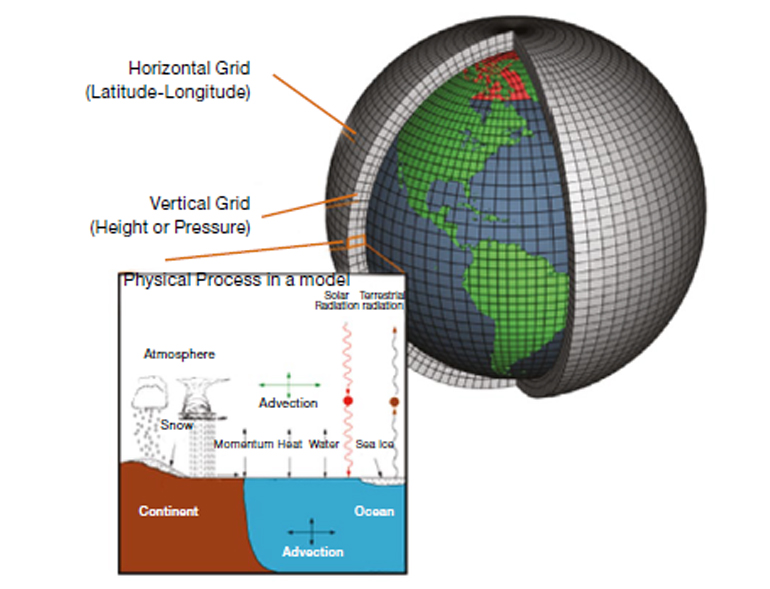
Source: Columbia University; as of 21 October 2021.
The model then calculates the state of the climate in each cell, establishing disparate elements such as pressure, temperature, humidity and wind speed. For processes that happen on scales that are too small to be captured by the grids (such as convection) the model uses “parameterisations” to fill in these gaps.1 These are essentially approximations that simplify each process and allow them to be included in the model. More recently, scientists have experimented with using different shapes for these grids, including cubed spheres and icosahedral grids. As a general rule, increasing the spatial resolution of a model by a factor of two will require around ten times the computing power to run the model in the same amount of time.
Every model is a series of compromises between accuracy and the amount of computer power and time required to run the model. The size of each individual grid is only one element that can be altered to provide a more accurate orswifter result. Once the grids have been laid out, the next stage is to calibrate the frequency with which the model calculates the state of the climate system – this is known as the “time step” process. Depending on the aims of the climate model, each time step can be set at minutes, hours, days or even years. Smaller time steps give more accurate results, but at the expense of requiring greater computer power.
Once climate models are constructed, they are hindcasted, running the model backwards against recorded data to test for accuracy. Scientists are then able to adjust the models based on how closely they mirror observed data. Once a model performs well in hindcasting, its results are assumed to be valid, and it is then used to create simulations of future climate scenarios.2
Chapter 3: Climate Scenarios
Forecasting climate is a science, but it’s also an art. Any climate model is only as good as the scenarios it works with – these scenarios can be thought of as narratives around the future path of human development. This means that scientists need to estimate the growth of populations, the way land is used, the evolution of economies and, crucially, the extent to which technology will help humans to mitigate the impact of detrimental gas release.
In 2000, the Intergovernmental Panel on Climate Change (IPCC) issued its Special Report on Emissions Scenarios (SRES), constructing four scenario families to describe a range of possible future conditions. Referred to by letter-number combinations such as A1, A2, B1, and B2, each scenario was based on a complex relationship between the socioeconomic forces driving greenhouse gas and aerosol3 emissions and the levels to which those emissions would climb during the 21st century. Climate scientists used this data to produce estimates of how much CO2 the world can continue to emit and still keep global average temperature rise to no more than 1.5°C, 2°C or 3°C above pre-industrial levels. These are known as carbon budgets.
For each temperature limit the IPCC produced three specific budgets, each corresponding to a different probability of staying below that limit: 66%, 50% and 33%. Figure 5 shows how many years are left of current emissions before we breach the 66% budget of a 1.5°C rise, according to a variety of different models.
Figure 5. Remaining Carbon Budgets
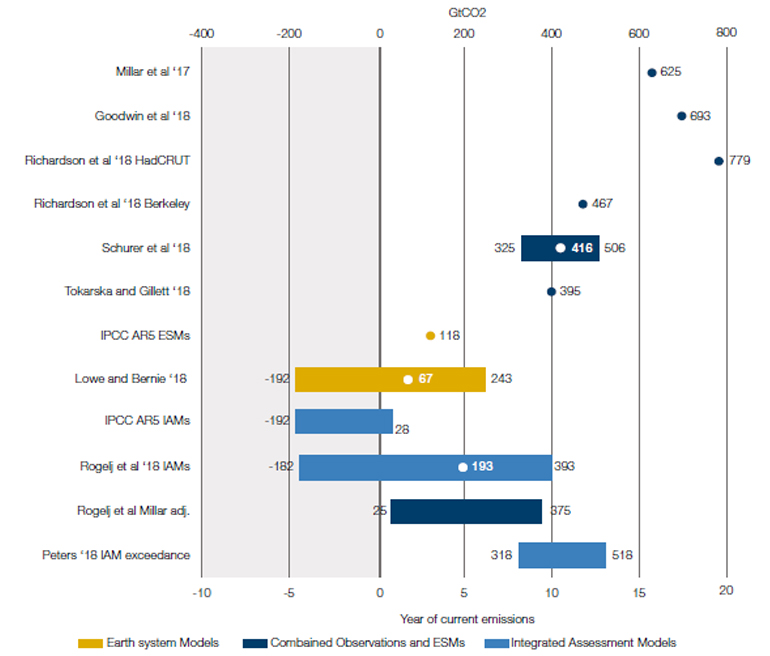
Source: Carbon Brief; as of 21 October 2021.
Chapter 4: AR6
August 2021 saw the release of the Intergovernmental Panel on Climate Change’s (‘IPCC’) Assessment Report 6, with significant press and public attention generated around the key findings of the report. The Secretary-General of the UN, António Guterres, called the report a “code red for humanity.” AR6 saw a distinct change in both tone and substance of the IPCC’s communications. The headline was clear – there is no longer room for doubt about humanity’s role in global heating and time is running out for meaningful action to be taken. In the words of the report, “It is unequivocal that human influence has warmed the atmosphere, ocean and land. Widespread and rapid changes in the atmosphere, ocean, cryosphere and biosphere have occurred… Global surface temperature will continue to increase until at least the mid-century under all emissions scenarios considered. Global warming of 1.5°C and 2°C will be exceeded during the 21st century unless deep reductions in CO2 and other greenhouse gas emissions occur in the coming decades.”
AR6 adjusted scenario modelling to take into account both the greater visibility of data and improvements in technology – both the modelling capabilities of computers and the various technologies helping to drive the world towards a lower-carbon future. Previously, the IPCC used two distinct forms of climate scenario, representative carbon pathways (‘RCPs’) and shared socioeconomic pathways (SSPs). SSPs chart socioeconomic pathways whereas RCPs measure physical forcing. In previous assessment reports there was a matrix of SSPs and RCPs. For example, there could be an SSP2/RCP4.5 or SSP3/RCP6.0 world. In recognition of the fact that it is impossible to separate socioeconomic activity from the forcings associated with this activity, the IPCC has now retired RCPs and focuses solely on SSPs.
SSPs give a best estimate and range of very likely outcomes for global heating in three distinct time periods:2021-2040, 2041-2060, 2060-2100. SSP 1-1.9 is the pathway associated with maintaining temperatures below the crucial 1.5-degree level.
Figure 6. Shared Socioeconomic Pathways Grid
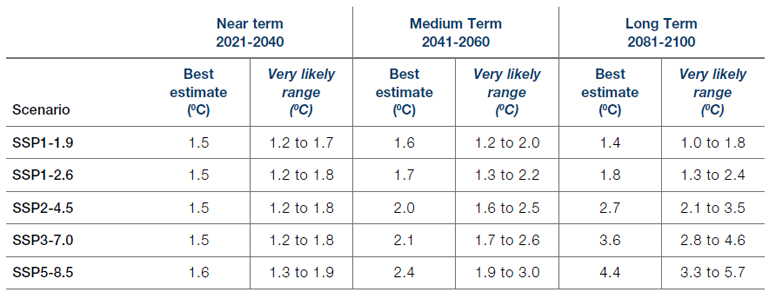
Source: IPCC; as of 21 October 2021.
SSPs seek to provide narratives that explain the potential path of carbon emissions from a societal and economic standpoint, taking into account both concrete elements such as population density and GDP per capita and more nuanced, abstract ideas, like the extent to which countries are prepared to work together to tackle climate change, whether technology is able to address global heating and how much the move to a green economy is able to prompt a levelling-up of less developed nations. SSPs also employ a more sophisticated and nuanced understanding of the interplay of different emissions, with a greater focus placed on the role of methane in global heating as well as the mitigating impact performed by aerosol emissions4. This interplay of the two dominant environmental crises of recent years – global heating and ozone destruction – is complex and nuanced (Figure 7).
Figure 7. Contributions to 2010-2019 Warming Relative to 1850-1900
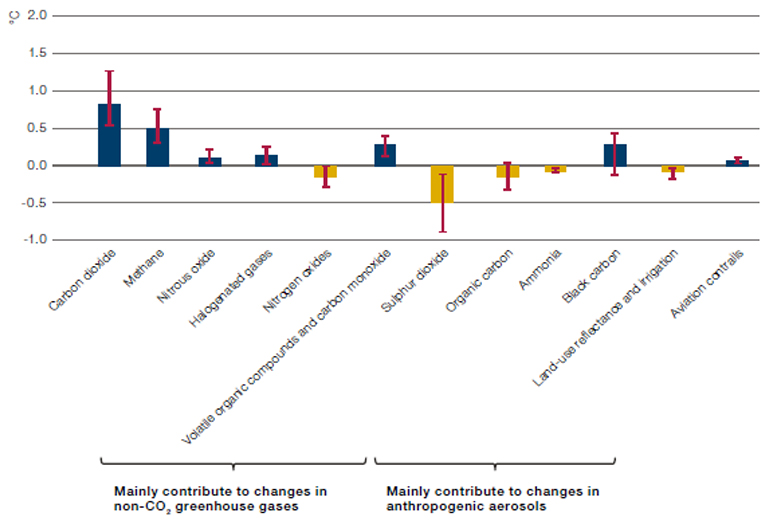
Source: IPCC; as of 21 October 2021.
The SSPs provide a more detailed and yet intuitive picture of the paths of global heating associated - not only with emissions but crucially with the geopolitical and economic backdrops against which these emissions are released. Figure 8 shows the emission pathways associated with these SSPs.
Figure 8. Future Emission Pathways
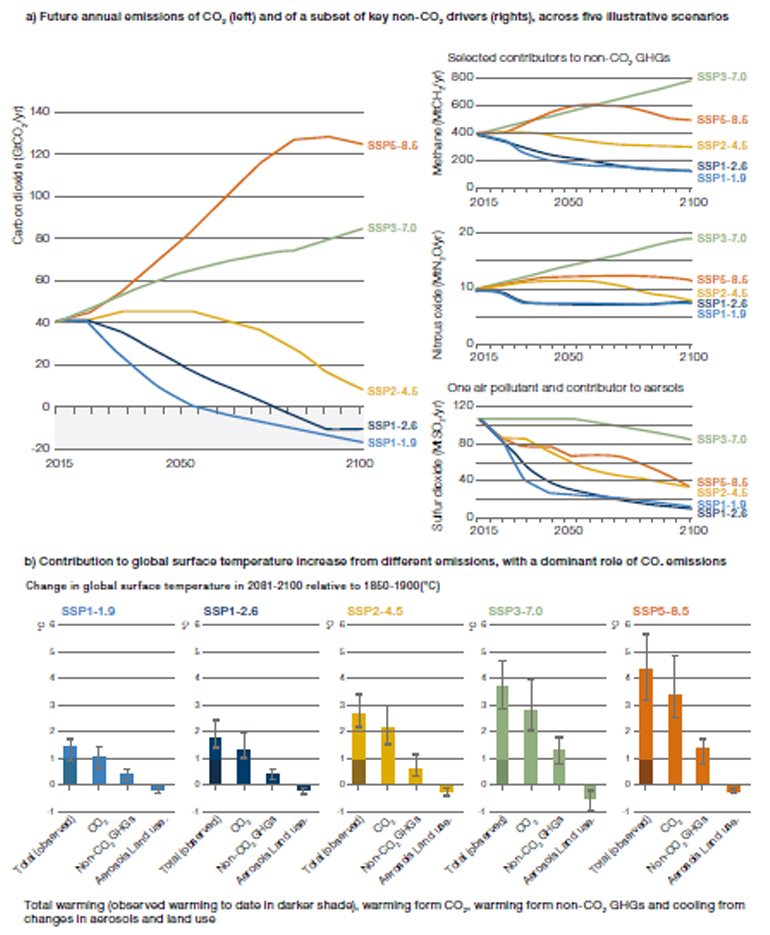
Source: IPCC; as of 21 October 2021. Pathways calculated from 2015-2100.
The IPCC is now working to pull together a Synthesis Report, which will represent the final element of the AR6 process and will be released in September 2022. This Synthesis Report will bring together all the different aspects of AR6 and will seek to provide further guidance on the action needed to address climate change. The first section of the Synthesis Report, ‘Current Status and Trends’, covers the historical and present period. The second section, ‘Long-term Climate and Development Futures’, addresses projected futures up to 2100 and beyond. The final section is ‘Near-Term Responses in a Changing Climate’, considers current international policy timeframes, and the time interval between now and 2030-2040. The Synthesis Report will be viewed in draft at the United Nations Climate Change Conference (COP26) in Glasgow in October and November 2021. We should expect the release of this report to garner significant coverage and further sharpen the pace and intensity of action on climate change.
The next iteration of the IPCC’s process, AR7, will be released in 2028.
Chapter 5: The Paris Agreement
Serious efforts to limit global heating began with the Rio Earth Summit in 1992, followed by the Kyoto Protocol of 1997. The latter issued legally-binding obligations for developed nations to reduce their carbon emissions in the years 2008-2012. The Doha Agreement covered the years 2012-2021. The US did not ratify the Kyoto Protocol, while Canada renounced it in 2012. All 37 other “Annex 1” countries that ratified the Protocol met their obligations – essentially the EU and EEA, Australia, New Zealand, Ukraine and Japan. The next challenge was to find a climate agreement that the whole world could get behind.
Figure 9. A Timeline of Climate Negotiations
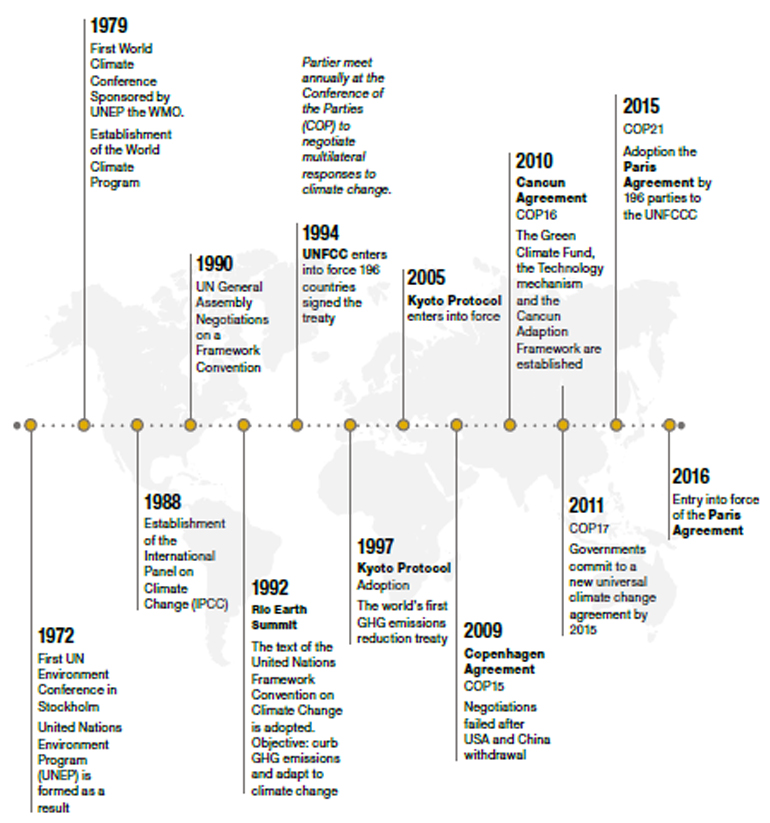
Source: CliMates; as of 21 October 2021.
The Paris Agreement is the fruit of decades of work by governments and nongovernmental agencies to establish a roadmap towards a future in which global heating is kept below levels which would be severely damaging to the planet as a whole. It is a legally binding international treaty that was adopted at the COP 21 in Paris, on 12 December 2015 and entered into force on 4 November 2016. The goal of the agreement is to limit global warming to “well below 2°C, preferably to 1.5°C,” compared to pre-industrial levels. In order to achieve this long-term goal, countries have agreed to begin to move towards carbon neutrality as swiftly as possible, with a general goal of achieving a climate-neutral world by 2050. While the US briefly withdrew from the Agreement under the Trump Presidency, it has now re-ratified, meaning that the vast majority of the globe now falls under the aegis of the agreement (only Iran and Turkey remain outside the accord as far as major polluters go).
The mechanism for achieving this goal is a series of increasingly aggressive 5-year plans, each of which has been scrupulously designed using the best available science with the aim of transforming the global economic and social landscape. Countries were required to submit their Nationally Determined Contributions (NDCs) in 2020, outlining how and when they will reduce greenhouse gas emissions in line with Paris Agreement goals. The NDCs also outline the steps each country will take to adapt to the challenges of a warmer world.
Figure 10. Paris Climate Agreement – Key Points
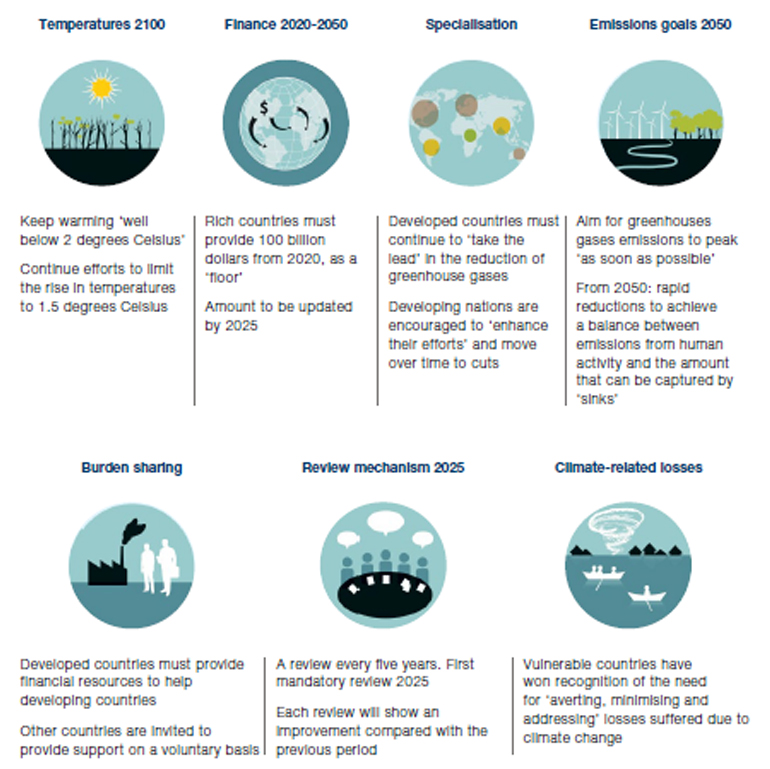
Source: AFP
Alongside the NDCs, countries had to set out non-binding development plans that establish priorities and strategies for ensuring that emissions are kept low over the long-term.
The NDCs will be monitored via a series of “Global Stocktakes” every five years that measure the extent to which goals are being met. Article 13 of the Paris Agreement articulates an “enhanced transparency framework for action and support” that establishes harmonized monitoring, reporting, and verification (‘MRV’) requirements. Both developed and developing nations must report every two years on their mitigation efforts, and all parties will be subject to technical and peer review.
Different countries have approached the NDC process in different fashions. It’s important to note that, according to the Climate Action Tracker, only one country’s NDCs are currently adequate to meet the 1.5°C target – The Gambia – while a handful more – including the UK – hit the 2°C target. At the other end of the scale are countries like Turkey, who have not ratified the Agreement, and Russia, Saudi Arabia, Ukraine, and Argentina, whose NDCs are viewed as woefully insufficient.
Figure 11. Country Rankings on the Path to Paris
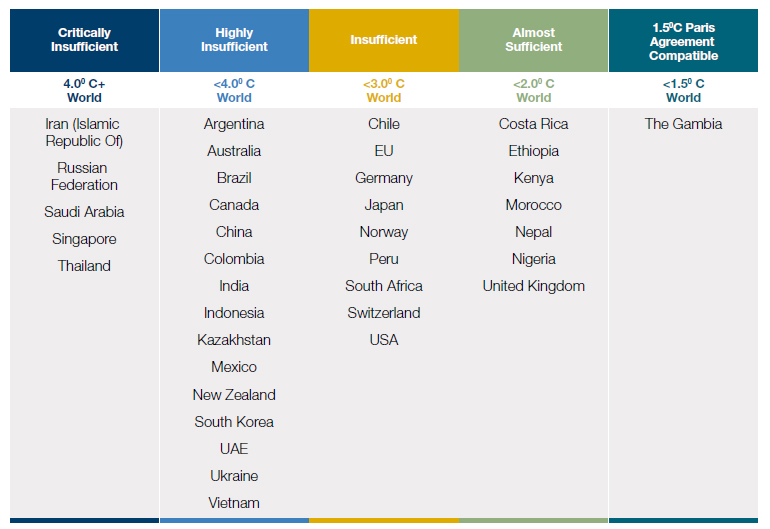
Source: Climate Action Tracker; as of 21 October 2021.
It’s important to recognise the accretive and ratcheting nature of the NDCs, and the in-built (some would say optimistic) momentum that is anticipated to develop as the path to 2050 progresses. As it stands, the pledges made by countries in the Paris Agreement will not keep global heating below 1.5°C (or even, for that matter, 2°C)5, but it is hoped that the ambition mechanism will see an increasing level of impetus twinned with further technological advances to drive more substantial gains in the latter years of the timeline.
Conclusion
With COP26 in Glasgow about to begin as we write this paper and the need for action on climate change becoming ever clearer, the world of climate science is moving at a frantic pace. Even as we have been writing we have had to update and refine our work to reflect new research and new perspectives. That said, we believe that the science reflected here gives the reader a useful introduction to the key concepts of climate modelling and the way this modelling has fed into regulation and targets that will increasingly dominate the worldview of corporations and those who invest in them.
1. For a fuller account of parameterisation see: McFarlane, N. (2011), “Parameterizations: representing key processes in climate models without resolving them”, WIREs Clim Change, 2: 482-497. 2
2. For an exploration of overfitting in the backtesting of climate models and how to correct for it, see: Joris P.C. Eekhout, Agustín Millares-Valenzuela, Alberto MartínezSalvador, Rafael García-Lorenzo, Pedro Pérez-Cutillas, Carmelo Conesa-García, Joris Vente, “A process-based soil erosion model ensemble to assess model uncertainty in climate-change impact assessments”, Land Degradation & Development, 10.1002/ldr.3920, 32, 7, (2409-2422), (2021).
3. Defined as a suspension system of solid or liquid particles in a gas. Principal anthropogenic aerosol emissions are particulate air pollutants and smoke
4. Recognising the fact that without the counterbalancing cooling effect of aerosol emissions, temperature rises would have been more severe.
5. We have calculated that current pledges would take us to just over 4°C of warming by 2050.
You are now leaving Man Group’s website
You are leaving Man Group’s website and entering a third-party website that is not controlled, maintained, or monitored by Man Group. Man Group is not responsible for the content or availability of the third-party website. By leaving Man Group’s website, you will be subject to the third-party website’s terms, policies and/or notices, including those related to privacy and security, as applicable.