Introduction
Imagine a timeline as follows:
- Mid-February, 2020: As it becomes obvious that the world is going into lockdown, you google what vegetables you can freeze. Of course, everyone is also in a panic about toilet paper, so you also google where to bulk buy that commodity.
- Early March, 2020: A few days into lockdown, and no gym access, you figure you should get some exercise in somehow. Google ‘push-ups’.
- Mid-March, 2020: You’re over the same recipe of cooking those vegetables you had frozen early on in the lockdown. Start googling ‘recipes’.
- Mid-March 2020: You’re feeling a bit ill, and seem to have lost your sense of taste and sense of smell. Google ‘Loss of taste’ and ‘loss of smell’.
It’s astounding what these google searches can tell us about trends. These examples represent some of the most common search terms during each period, and had an eerily close relationship to consumer behaviour during the coronacrisis. First, supermarkets and household goods companies experienced unprecedented demand. Then, as consumers adjusted to lockdown and locked to establish a new routine, businesses that sell fitness equipment saw a pick-up in demand. And as more infections occurred, searches for specific symptoms rocketed – to the point where ‘loss of taste’ and ‘loss of smell’ were added to the World Health Organisation’s and US agencies’ lists as a “less common symptom” of coronavirus almost a full month after these search trends appeared!1
Figure 1. Google Search Trends: Push-Ups, Freezing Vegetables, Toilet Paper and Recipes (US, Weekly)
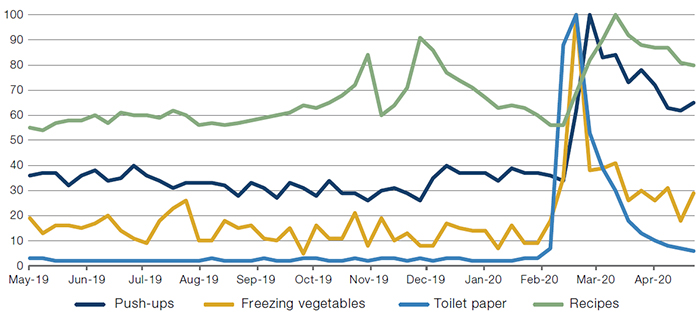
Source: Google Trends; as of 17 May 2020.
Figure 2. Google Search Trends: Loss of Taste and Loss of Smell (US, Weekly)
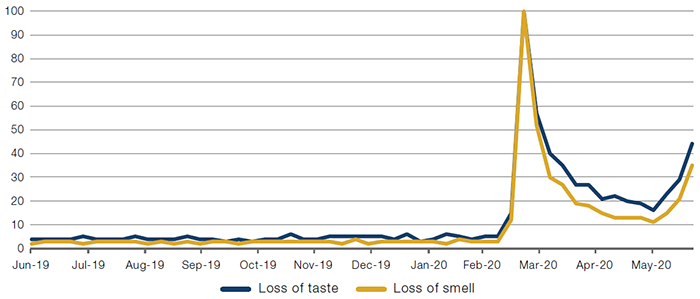
Source: Google Trends; as of 21 June 2020.
Not a Crystal Ball, But the Next Best Thing?
Google Search is a powerful tool. Whilst not a crystal ball, by allowing us to see into the minds of consumers in something close to real time, it provides invaluable investment insights. When we combine it with other forms of alternative data, we are looking at datasets which offer active portfolio managers very powerful tools with which to potentially enhance their investment processes.
Take, for example, the number of Google searches for a Mexican restaurant chain. Intuitively, one would assume that such a business would not do well during the coronacrisis: restaurants have a business model which is not conducive to social distancing and have been closed in many countries since the start of the lockdowns. However, in the aftermath of lockdown, searches for the restaurant chain increased, as consumers looked to continue eating their favourite food but switched from eating in to takeaway and delivery options (Figure 3). So, while it would be natural to expect the lockdown to have a negative impact on the restaurant’s earnings, looking at a simple but alternative data source such as Google search suggests otherwise. Importantly, such data can be reviewed in real time, allowing portfolio managers to initiate and/or adjust positions before official earnings announcements affect the price of the stock.
Figure 3. Google Search Trends: a Mexican Restaurant Chain (US, Weekly)
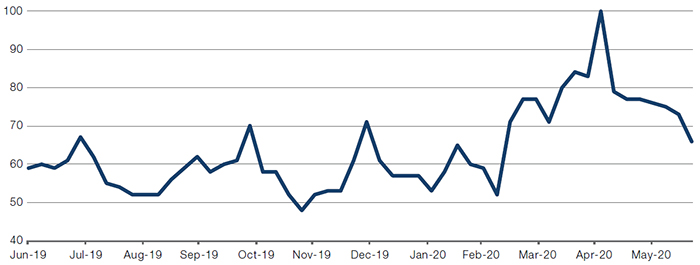
Source: Google Trends; as of 21 June 2020.
Website visits are another useful alternative data point, allowing us to separate company specific trends from general sectoral performance. Food delivery businesses thrived during the coronacrisis, with Grubhub, DoorDash and Uber Eats all seeing an uptick in their website visits. On the other hand, OpenTable – which offers a restaurant reservation service – saw website visits fall as restaurants closed their doors (Figure 4).
Figure 4. Website Unique Visits: Grubhub, DoorDash, Uber Eats and OpenTable
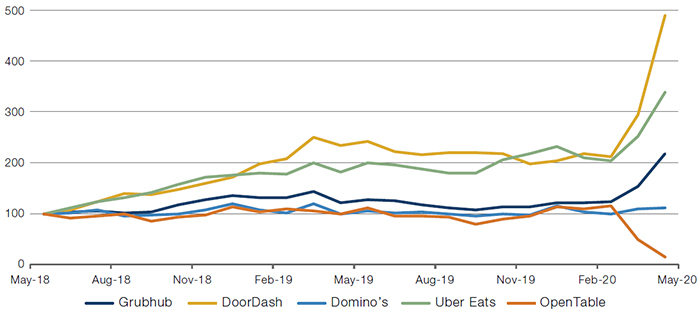
Source: SimilarWeb; as of 1 April 2020.
Indexed to 100 as of May 2018.
Alternative Data as a Contrarian Indicator
And as weeks go on and country after country comes out of lockdown, it would seem only natural to think that hospitality and leisure stocks – such as airlines – would see their share prices rise. However, Google search trends show that, in fact, after a spike in February (when demand was likely driven by the urgent need to book flights home before the global economy entered lockdown), there has been very little pick-up since (Figure 5).
And even more accuracy can be gained by combining multiple sources of alternative data: sales data based on credit cards shows that while airlines may again be open for business, very few people are actually buying tickets (Figure 6). So, while poor sales data alone wouldn’t govern whether an active manager enters a position, it can allow them to better assess whether market movements are sentiment-driven, or have an underlying fundamental driver which needs to be accounted, and better test their investment thesis in relation to each stock.
Figure 5. Google Search Trends: Flights (US, Weekly)
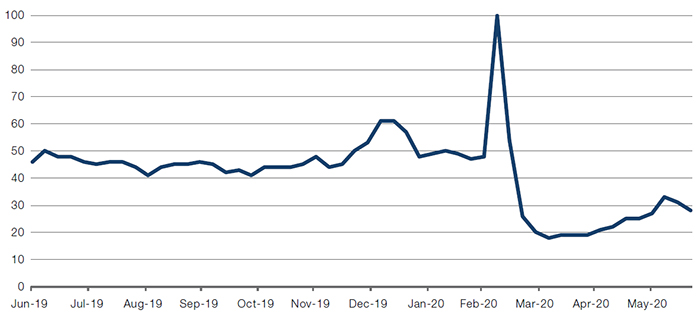
Source: Google Trends; as of 21 June 2020.
Figure 6. Weekly Credit Card Spend – US Airlines
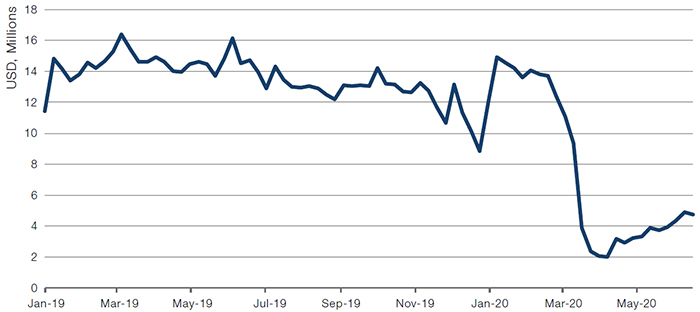
Source: Consumer Edge; as of 21 June 2020.
But it’s not just Google search trends or consumer card data that can be a good source of alternative data. Very early on during the coronacrisis, job postings data not only showed the specificity of which US states showed a decline in job postings (Figure 7), but also which companies were actively hiring during lockdown (Figure 8). Just as with the Mexican restaurant example above, the timeliness of this job postings data can serve as a useful lead indicator of which firms were seeing an increased demand for their products.
Figure 7. Job Postings by US State
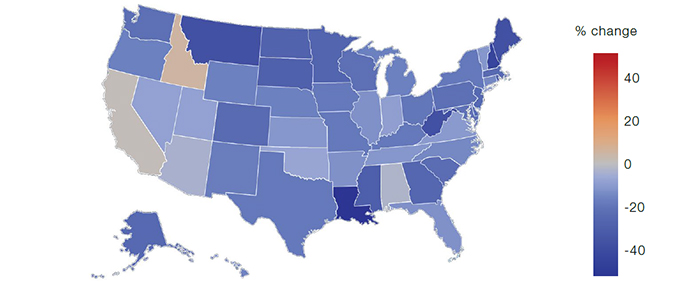
Source: Linkup; between 2-9 March 2020.
Figure 8. Unique Active Open Job Count
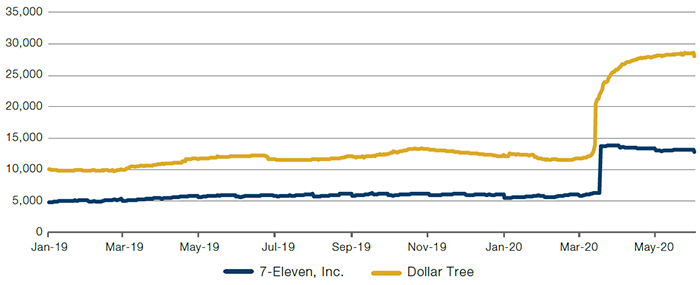
Source: Linkup; as of 1 June 2020.
A Word of Caution
While we are big believers in that alternative data can provide an edge, signals can be hard to find and when found, can vanish quickly as other portfolio managers could be exploring the same sources of data. Indeed, we have written previously of what to be mindful of when exploring alternative data.
Credit card data provides a good caveat as to the limitations of alternative data, as it is almost exclusively limited to consumer data. If a company generates its revenues from business-to-business sales, credit card data will have very little predictive power when trying to forecast sales. Likewise, the usefulness of data can deteriorate as consumer habits change. UK card transaction data has shown negative sales for fast-fashion firms such as Asos since the start of the coronacrisis, despite it reporting positive sales growth. We believe this discrepancy was caused by the firm offering a ‘buy now, pay later’ scheme to offset temporary falls in consumer incomes as a result of the downturn.
In addition, longer-term consumer trends can have an effect: the widespread adoption of mobile payments technology such as Alipay in China has rendered the accuracy of credit card data for predicting sales less accurate. Geography also plays a part: datasets such as ConsumerEdge use only US data, which forces investors to make adjustments for firms which have the majority of their sales overseas.
Overall, alternative data requires careful assessment: just because a dataset exists doesn’t mean that it will highlight economically relevant relationships, nor will it necessarily maintain accuracy over time. Instead of blindly throwing data into a mixer and expecting to generate alpha, investors should carefully consider the nature of each data set, selecting the right data to answer the right question.
Conclusion
The coronavirus has thrown markets into disarray. But instead of flying blindly on instinct, alternative data allows portfolio managers to cut through the noise to see what consumers are actually thinking and doing. Using alternative data gives portfolio managers the ability to enhance their investment process, more accurately predicting performance of stocks. Alternative data isn’t a crystal ball – but in the depths of the coronacrisis, it was the next best thing.
1. Source: The Centre for Evidence-Based Medicine; Loss of smell and taste as symptoms of Covid-19: what does the evidence say?; 20 May 2020.
You are now leaving Man Group’s website
You are leaving Man Group’s website and entering a third-party website that is not controlled, maintained, or monitored by Man Group. Man Group is not responsible for the content or availability of the third-party website. By leaving Man Group’s website, you will be subject to the third-party website’s terms, policies and/or notices, including those related to privacy and security, as applicable.