Introduction
We believe the UK has the potential to outperform developed market (‘DM’) equities over the next 12 months for five reasons:
- A big dislocation in the historically strong inverse relationship between sterling strength and FTSE outperformance;
- There is a big valuation discount from Brexit overhang;
- Equity investors have been running out of the UK, leaving positioning light;
- A strong commitment by the UK government to spending is likely to unlock an infrastructure jamboree;
- The worst of the Covid impact is over, in our view.
Where Are We Today?
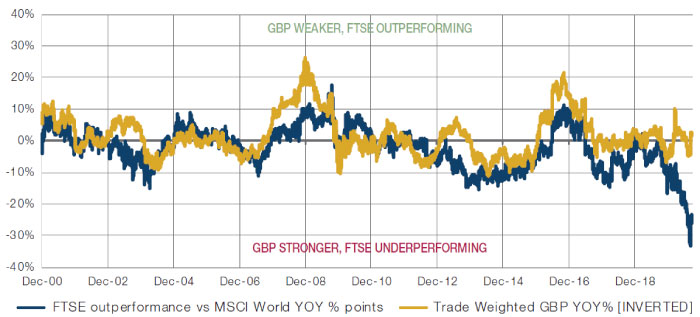
To start with, we would note the strangeness of the current bout of FTSE performance, in the context of foreign exchange dynamics. Figure 1 shows a very close inverse relationship between sterling strength and UK outperformance, as we would expect given the high international proportion of FTSE revenues. At time of writing, this historical precedent would suggest the FTSE should have outperformed by 3 points over the past year. The reality? -26 points.1
Figure 1. UK Outperformance and Trade-Weighted Currency2
Source: Man Group; as of 22 September.
Valuations
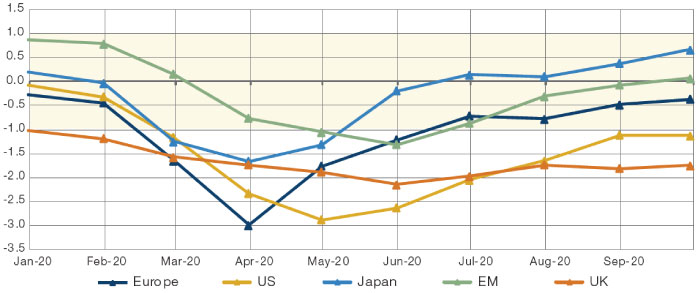
Secondly, we assess valuations using the Composite Valuation Indicator (‘CVI’) framework, which compares five types of equity yield with bond yields, cash rates and inflation. At present, the UK has by some distance the most attractive CVI, as shown in Figure 2. This has been driven both by a relatively muted decline in equity yields, as well as cost of debt drivers falling further. Since March, the earnings yield in the UK has fallen 50 basis points (to 8.3%), compared with -190bp in Europe (to 5.8%). On the other side of the equation, the UK cash rate fell 54bp, whilst Europe, given its starting point was negative, only reduced by 20bp.
Figure 2. CVIs
Source: Man Group; as of 30 September 2020.
Yellow shaded area is neutral zone, >+1 is SELL, <-1 is BUY.
Flows
Thirdly, flows. So far in 2020, the UK has been less badly hit by outflows than the rest of the world. As at the end of July, investors had pulled USD7 billion from UK equities3 – or 0.8% of start-of-year assets (USD964 billion). The equivalent figures for rest of world were an outflow of USD220 billion on starting assets of USD18.6 trillion, to get a net outflow of 1.2%. This contrasts with the previous two years, where the UK experienced a 2.5% net outflow in aggregate, versus -1.6% from world ex-UK. To us, this is indicative of a turning point: investors are so light on the UK that flows can start being a tailwind relative to other geographies.
Investment
Fourth, investment. We think the political imperative on the ‘levelling up’ expansionary fiscal agenda has become paramount. The percentage of the UK public that approve of the government’s pandemic response has fallen from 72% in March to 30% today, the lowest of any nation. Germany, by comparison, has held steady at 70% since March.4 The Conservatives score much better in voting intention polls, however, consistently level or with a small lead.5 How can the public take such a dim view of the government’s handling of a generational issue and yet not be punishing them more in terms of voting intention? The political scientists suspect it’s driven by the party’s new ‘red wall’ base holding up better than expected. This is the constituency that will most benefit from Tory investment plans. And we don’t think Boris has forgotten who he owes.
The pandemic has turbo-charged and normalised previously unthinkable levels of government intervention. The UK is slated to run a budget deficit of 14% in 2020. In the last 320 years, this has only been exceeded during the two World Wars (26% and 27%, respectively). Government investment rose 11% quarter-on-quarter for the second quarter, taking it from 3 to 4 points of GDP. We believe this trend will continue.
Post Covid-19
Below, we make the case as to why we believe the worst of the Covid impact is over. The phrase that has been used to describe the first half of 2020 is ‘unprecedented’. Whilst we are hugely sympathetic to this view, what is abundantly clear by the response from central bankers and governments is that this is absolutely not lost on them.
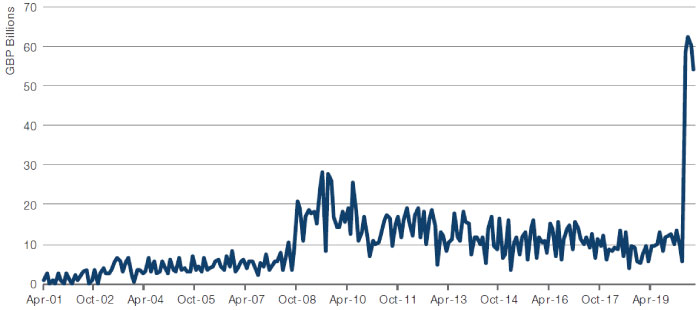
First, UK debt issuance on a monthly basis is around 6x higher than at the start of the year and materially dwarfs what was seen even during the Global Financial Crisis.
Figure 3. DMO Monthly Gilt Issuance
Source: Lazarus Partnership; as of 28 August 2020.
Monetary stimulus is also well in excess of what was seen during the GFC and there is extremely good evidence to suggest that these are just not statistics and that this stimulus has made its way rapidly into the economy. In the three months to end May, for instance, UK bank deposits rose by GBP160 billion, or 8% of GDP.
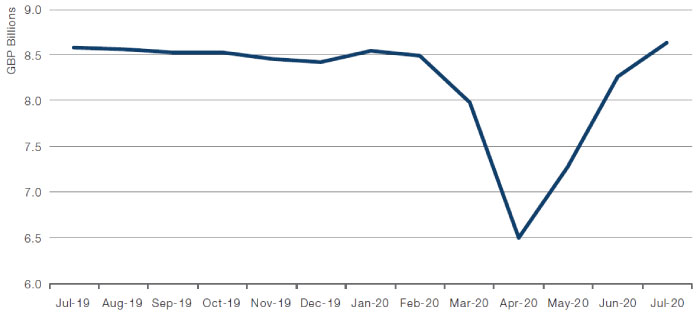
Also, while much debate exists about the shape of the recovery, it is hard to refute that retail sales, for example, have shown anything other than an extremely symmetrical V-shaped recovery.
Figure 4. Weekly UK Retail Sales
Source: Lazarus Partnership; as of 28 August 2020.
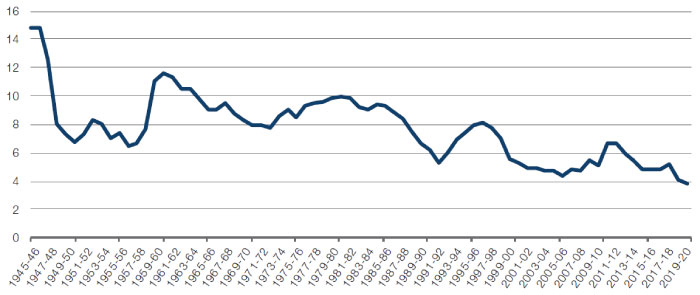
Of course, given the size of the budget deficits now being experienced by governments in order to secure the economic rebound, our sense is that a fear about affordability exists. However, as has been well-documented, the bond market has been incredibly accommodating with bond yields falling to all-time lows, which means that debt servicing as a percentage of the tax take is now reaching all-time lows.
Figure 5. Debt Interest to Revenue Ratio
Source: Lazarus Partnership; as of 28 August 2020.
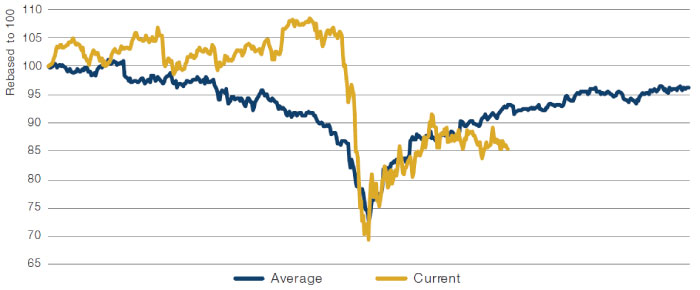
Turning to look at market moves, we would firstly make the irrefutable observation that we have entered a bear market (defined by a greater than 20% fall). Below we show comparison with the eight other bear markets seen in the UK stock market since we have reliable daily data.
Figure 6. FTSE All-Share Index Average Bear Markets Versus Current Bear Market
Source: Bloomberg; as of 28 August 2020.
Average 12-month return before and after market trough.
The recovery initially closely mirrored prior experience, but in the last two months, it has lagged somewhat. Should we enjoy a reconnection with this historical precedent, then we can expect above-average returns in the coming months. Moreover, we are seeing extreme relative value on offer for UK equities. Indeed, the geography is currently trading at a 38-point discount (based on price-to-earnings, price-to-book value and price-to-dividends ratios), relative to DM.6 This is akin to that seen in the mid-1970s.
In our view, the most significant factor at play in this discount is Brexit, and this conclusion is drawn from the fact that outflows from UK equites are statistically the most significant of any major asset class.
We acknowledge that providing predictions on Brexit has been a fool’s errand. However, we are, in theory, approaching an immovable deadline for the talks. Given our focus on historical precedent, we believe that the trade deal signed by then EU with Canada in 2016 gives us a reasonable prediction of what is likely to come.
Below is a quote for the Canadian Trade Minister on 21 October, 2016:
“...it seems evident for me, and for Canada, that the EU is not capable now to have an international deal. Even with a country with such European values like Canada and with a polite and patient country such as Canada. Canada is disappointed, me personally I am very disappointed. I worked very, very hard but it I think it is impossible. We have decided to go back home and I am very, very sad, truly.”
By the end of the month, the trade deal was signed. It therefore seems highly probable to us that the prospects of us thinking that there will be no deal are extremely close to 100%, but that ultimately, the probability of there being a deal is close to 100%. This is likely to, of course, provide plenty of volatility. However, as active managers, we welcome this. Ultimately, the value on offer domestically, in our view, looks substantial.
Opportunities in Housebuilding Sector
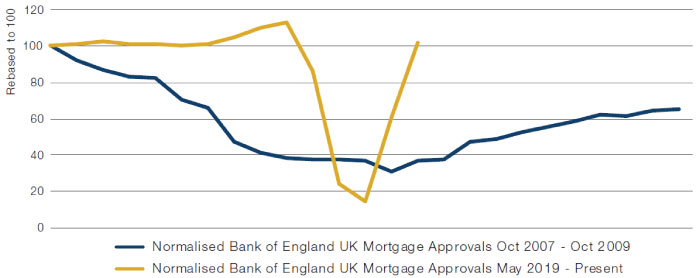
One such area is house-builders. Further to the rebound in retail sales shown in Figure 4, the trajectory of the biggest of big-ticket items, namely a house, shows a different pattern to that following the GFC.
Figure 7. Mortgage Approvals
Source: Bloomberg; as of 4 September 2020.
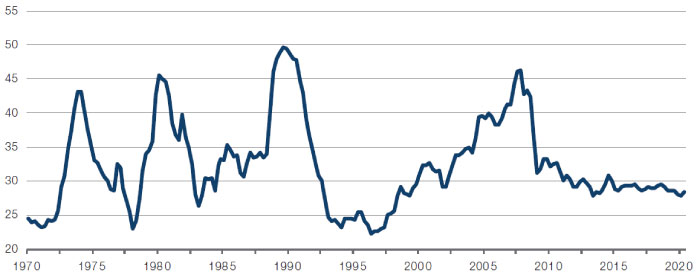
Furthermore, we do not share the caution that we sense exists about the prevailing levels of house prices. This is due to the fact that we think it is reasonable for an asset that is so closely linked to the level of interest rates to enjoy upward momentum as a result of their demise to a record low levels. In making this point, Figure 9 shows housing affordability as gauged by initial mortgage payments as a percentage of average post tax earnings.
Figure 8. Initial Mortgage Payments as a % of Post-Tax Earnings
Source: Lazarus Partnership; as of 28 August 2020.
Currently, we are at levels seen on four prior occasions. On each and every one of these occasions, house price inflation was positive. Put simply, we think the average house price is good value by historical standards and is currently far cheaper than the rental equivalent.
Conclusion
Year-to-date, the UK has been one of the most unloved equity markets in the world. However, there are reasons for optimism. A big dislocation in the historically strong inverse relationship between sterling strength and FTSE outperformance has caught our attention, and the geography still has the benefits of a Brexit valuation discount, light positioning, and a possible government fiscal investment extravaganza.
We also believe the worst of the Covid impact is over. Indeed, our view is that the recent stimulus and political narrative could drive a different outcome to both growth and inflation than that seen in the wake of the GFC. Should this happen, then this will have profound implications for the Growth versus Value debate.
Of course, left-tail events – such as a meaningful second wave of the virus and a no-deal Brexit – exist. However, in the right tail, we would cite the possibility of extremely coordinated stimulus, a vaccine and a satisfactory Brexit deal as categorically not being without probability.
As such, we believe the UK may well outperform other developed markets over the next 12 months.
1. As of 22 September 2020.
2. Trade-weighted GBP calculation from Deutsche Bank.
3. Source: EPFR.
4. Source: YouGov; as of 23 September, 2020.
5. Source: YouGov; as of 16-17 September, 2020.
6 Source:Morgan Stanley.


You are now leaving Man Group’s website
You are leaving Man Group’s website and entering a third-party website that is not controlled, maintained, or monitored by Man Group. Man Group is not responsible for the content or availability of the third-party website. By leaving Man Group’s website, you will be subject to the third-party website’s terms, policies and/or notices, including those related to privacy and security, as applicable.