Introduction
At times like this, when questions are many and answers few, the first thing to do is to narrow down one’s list of questions to what really matters, and focus on that. Here is what we are asking ourselves:
- What have asset markets priced in?
- Has consensus repositioned so that forced de-risking is over?
- Is the policy response adequate?
- Will it get worse before it gets better?
- Are we at a secular inflection point in the inflation regime?
It’s much easier to ask these questions than to answer them, of course. What we can do, though, is surround each one with facts, with our models, and even with anecdote, to paint a picture. Here are our observations.
Question 1: What Have Asset Markets Priced In?
Markets have moved a very long way in a very short period. In just 24 sessions1, the MSCI World (developed markets) equity index has fallen 33%. And the pain has been very evenly spread. The S&P 500, MSCI Emerging Markets, FTSE100 and DAX indices have fallen, respectively, 34%, 34%, 35% and 39%, peak to trough. The outperformer among major indices has been Japan’s Topix, down just 29% on the same basis.
But what does it mean when an equity index falls 30%? What profile of future cash flow has been priced in? To model this, we use a naïve short-term discounted cash flow (‘DCF’) model and compare with baseline forecasts prior to the Corona crisis hitting. We estimate that with markets down 33%, they have priced in earnings / cash flow falling to zero immediately, and then taking seven years to get back to the pre-crisis earnings trend. In other words, if last year was index 100 on earnings/cash flow, they are now priced to be zero this year, then index 14 next year, index 28 in 2022, index 42 in 2023, and so on until they get back to the prior trend in 2026.2 Obviously, this all assumes that equity markets were correctly priced in the first place, but that’s one hell of an earnings recession now priced in.
What about other major markets? We see historical analogy as meaningless in the government bond market when the 10-year US Treasury bond yields 0.5% (as it did on 9 March). In terms of what was incrementally priced into bonds during the equity market collapse, a fall of 120 basis points in three weeks has only happened twice in the last 20 years: during the Lehman Brothers’ collapse of 2008 and during the Eurozone crisis of 2011. In our view, it is a measure of just how dire long-term expectations already were before Corona reared its ugly head that the US 10-year Treasury Inflation Protected Securities (‘TIPS’) yield – viewed as a proxy for real growth expectations, and while recently volatile, on aggregate hardly budged – anchored as it increasingly is to zero. We believe this very bearish growth view embedded in the long end is the reason that the 10-year/2 year US Treasuries yield curve didn’t invert – the long end was already very depressed. But the message from the bond markets seems clear. A full recession looks more than priced into bonds – and that’s to entirely ignore the veritable tsunami of issuance we think is about to spew forth from everywhere.
Credit spreads have also priced in a very dark economic outcome. As Man GLG writes (at 1000 bp over mid-swap, Figure 1), US high yield (‘HY’) markets appear to be pricing in an expectation that 40% of all listed issuers would default at some point over the next five years. The two worst credit episodes in history were the 1930s, when 5-year cumulative default reached 32%, and the Great Financial Crisis (‘GFC’), when it reached 14% in high yield. Indeed, we should remember that in the GFC, in investment-grade (‘IG’), the actual default experience was actually little over 1% through 2008-09. The worst case is we think comfortably priced in high yield.
Figure 1. JP Morgan Developed High Yield Spread to Worst
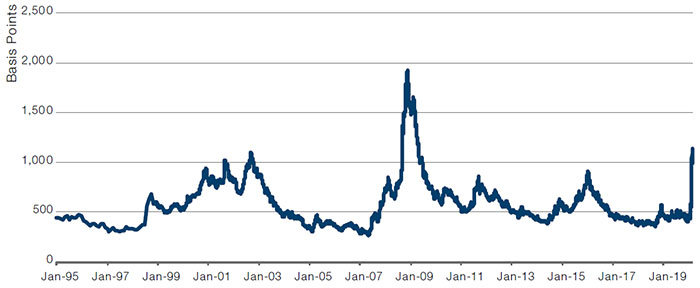
Source: JP Morgan, Bloomberg; as of 31 March 2020.
In IG, it’s less extreme, but valuation still takes account of a lot. US BBB spreads blew out from 130 bp to 450 bp. At that level, assuming 60% recovery, an 11% cumulative 7-year loss is priced in. According to our analysis using external sources3, the worst out-turn loss has been 3.6% in 1939, in the aftermath of the Great Depression. The cumulative loss following the GFC, by contrast, was little more than 1%, on the same assumptions.
When we compare cross-asset valuations, we use a Composite Valuation Indicator (‘CVI’) model. In most markets, the indicator has moved from around fair value (readings of zero) in late January to now the almost unprecedented level where equity markets are in some cases 3 standard deviations below fair value (Europe is -3.1, US -1.8, Japan -1.7 and EM -0.6). The one month (since the model went live in 1998) when the CVI was lower was October 2008, the month after Lehman fell. Apart from that and 2003, when it got to -4, equities have never been close to this level of relative under-valuation relative to bonds in the past 25 years.
And lastly on valuation, Empirical Research notes that valuation spread within equity markets reached four and a half standard deviation wides in the week commencing 16 March. They have only twice before seen spreads like this – you guessed it, during the Depression and the GFC (Figure 2).
Value equities may not work in secular stagnation with deflationary tendencies, such as we have been in for the last decade, but then again, we have rarely seen this level of valuation opportunity.
Our valuation conclusion: the markets seem to have priced in a deep U in earnings.
Figure 2. Large-Cap US Stocks Valuation Spreads - Top Quintile Compared to Average
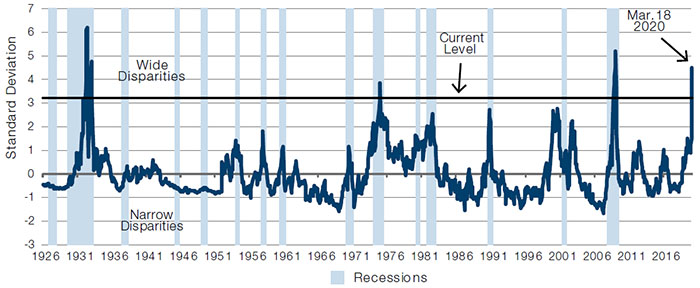
Source: National Bureau of Economic Research, Empirical Research Partners Analysis; as of 31 March 2020.
Prior to 1952, the spread is measured using the price-to-book data of the largest 1,500 stocks.
Question 2: Has Consensus Repositioned So That Forced De-risking Is Over?
You can never really be categorical about positioning across the market, but we do get several useful data points. Prime brokers (who service hedge fund clients) give us a good picture of where the long-short equity community has moved. We get good intelligence on where commodity trading advisors (‘CTAs’) have repositioned to. Investment banks estimate likely pension fund rebalancing flows. All of these indicate to us that the gut reaction de-risk has now passed its peak rate, in our view.
Let’s start with the long-short equity hedge funds. According to Morgan Stanley, the market leader in prime services, gross exposure fell from just over 200% to 163%, reaching a new record low gross on 18 March, 2020. Net exposure was also drastically cut back, from over 50% to 36%. Investment banking estimates of pension fund flows point to quarter-end equity buying in the USD100 billion range.4 This leads us to believe that CTAs are, by now, short equity and long bonds, in general.
So, you can say with some confidence that market professionals have, by now, generally de-risked and de-grossed. What you cannot say is whether this is the start of a more general move away from financial assets in the wider community. Will retail react to market losses by selling risk assets in their 401k accounts? Will there be such a general loss of confidence that retail investors redeem money market funds?
We believe it all comes down to the policy response.
Question 3: Is the Policy Response Adequate?
It is hard to overstate the scale of the damage done to the global economy. Various forecasters now have -20% and -30% GDP forecasts for China in the first quarter and/or the other major economies in the second quarter. US jobless claims have gone from a record low to the comically absurd. The immediate task for finance ministers and central bank governors around the world we think is two-fold: plug leaks in the financial system and get money into the pockets of workers and SMEs as soon as practicable. In the meantime, ensure forbearance from banks on mortgage payments, overdraft fees and loan facilities.
What has been promised so far?
As to the first task, shoring up the financial system, the aggregate central bank balance sheet growth is currently tracking USD6.5 trillion in new liquidity. The Federal Reserve alone is planning to double the size of its balance sheet from USD4.7 trillion to USD9 trillion. The Bank of England will expand balance sheet by two thirds. Interest rates have been slashed to the lowest ever, in aggregate. The global average policy rate is now 0.5%, at new all-time lows.
It’s not just the scale that is impressive, it’s the scope. Amid the alphabet soup of new programmes, we have the Fed’s Primary Market Corporate Credit Facility (‘PMCCF’) whose purpose is to maintain the flow of credit to large employers during the crisis; the Commercial Paper Funding Facility (‘CPFF’) to support all businesses; the Money Market Liquidity Facility (‘MMLF’) to support credit to households; the reactivated dollar swap lines between the Fed and initially four other major central banks, now widened to 13 central bank counterparts, to ensure no shortage of dollars around the world; and the Term Asset-Backed Securities Loan Facility (‘TALF’) for auto and student loans.
Rahm Emmanuel said you should “never let a good crisis go to waste”, and it is clear that central bankers and politicians understood the lesson of the 1930s Depression in their response to the 2008 GFC. Flood the system with liquidity, act as buyer of last resort for all the assets you can stomach, and make your programmes unlimited. Do “whatever it takes”. The contrast with Treasury Secretary Andrew Mellon during the Depression is stark. He is reported (by Herbert Hoover) to have advised the president: “liquidate labour, liquidate stocks, liquidate the farmers, liquidate real estate. Purge the rottenness out of the system”. Central banks in this crisis have done the exact opposite and truly done “whatever it takes”.
The speed of the response is also impressive. We should bear in mind that the 1930s Depression was as bad as it was because the wrong / too tight policy was pursued (by Hoover and Mellon) for three years! It was not until Franklin Roosevelt unilaterally decided to abandon the gold standard and devalue the dollar against gold just a month after his inauguration in March 1933 that deflation was turned to inflation and the great reflation started. Counterfactuals are impossible to guess with certainty, but you can be pretty sure that the Depression would have been much, much less aggressive had the US pursued an easing policy from the start. Today’s crop of finance ministers and central bankers seem to have taken these lessons very much to heart, helped no doubt by the recency of the GFC.
As far as the second policy objective goes, to get money into the pockets of SMEs and workers, it also seems to us that the response will be adequate. Morgan Stanley calculates that the G4+China fiscal expansion will be 440bps of GDP or around USD2.8 trillion. It further estimates the US budget deficit expanding to 13% of GDP for 2020, easily the biggest reading of the past 50 years (Figure 3). The aggregate G4+China deficit is expected to rise to 8.5% of GDP, above the 6.5% it reached immediately after the GFC.
Figure 3. US Annual Budget Deficit
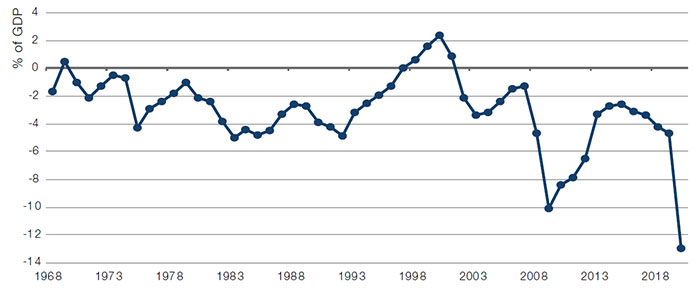
Source: Historic values from Bloomberg. 2020 estimate from Morgan Stanley. Each dot represents discrete calendar year.
So in scale, scope and speed, we believe that the response will prove to be enough contingent on governments being able to get cash to SMEs and workers quickly enough, but of course it’s impossible to know that. We take comfort from the tone that policymakers have struck, with their repeated insistence that they will do “whatever it takes”.
Question 4: Will it Get Worse Before it Gets Better?
We don’t know. However, it’s important to remain clear-headed about incremental market risks from this point. There are any number of things that could incrementally go wrong from here – things that we have no expertise or experience in modelling, mainly to do with the virus. From what we read, virologists do not expect that reinfection is likely with a Coronavirus, but what if it starts happening and say the Chinese total live case numbers start going up again? Or what if it mutates into something equally or more aggressive?
There is certainly room for more equity market downside to factor in that almost cataclysmic scenario. Historically, the Shiller price-to-earnings (‘PE’) ratio has been the best single valuation of measure for equities, we (and many others) find. The S&P 500 Index is now nearing 20x Shiller earnings. In the absolute lows of 2008, it got down to just below 15x (see Figure 4). And over the next year or two, we would expect Shiller earnings to fall (they are 10-year averages, and for the next two years, we believe earnings are very likely to be far below the current trailing 10-year average). On this basis, it is possible, and has happened before, that we could see another dramatic move lower in equity indices. It’s not base case for us, though, because absent any sign of the reinfection / reacceleration in Chinese/Iranian/Italian cases, it seems too much. But it could happen, obviously.
Figure 4. S&P 500 Shiller PE
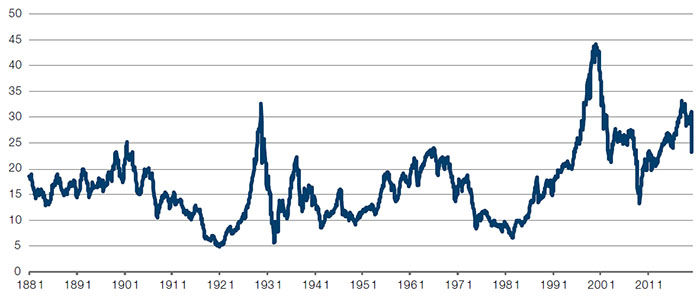
Source: Professor Robert Shiller; as of 31 March 2020.
Question 5: Are We at a Secular Inflection Point in the Inflation Regime?
If we are right that risk assets have priced in a very bleak scenario for the world economy and earnings; that positioning is clean; and that the policy response is unlikely to fall short of what is required to postpone Armageddon; then we could start to think about how to deploy risk in portfolios.
What inflation regime are we likely to be in? Will this huge monetary financing result in inflation? We have written at length about this. To the extent that the money stock is going to rise dramatically without an associated rise in productivity, we would expect that inflation will be higher. Is this likely to happen? We think so. Much will depend on how politicians decide to react to very high deficits and much higher debt/GDP balances.
However, it seems unlikely that the 2020s will be a repeat of the rolling austerity programmes of the 2010s for two reasons. First, there is no monetary policy ammunition left – we are out of basis points everywhere that matters. Second, and this is more speculative: given that we are receiving a practical demonstration of who really matters in keeping the economy going physically – it would seem a big stretch politically to try and impose new austerity on the very people who kept the supply chains going, fed us, and, most importantly, cared for our sick. Large deficits may be the new normal, facilitated by central banks duty bound to buy primary bond issuance and cap market interest rates – just as was the case immediately post war in the US up until 1951’s Fed Treasury accord.
We have also observed that all the major risk asset market troughs that we have lived through have seen a style rotation from growth to value and a change of market leadership. It would not at all surprise us if value stocks started to lead the market again, after more than a decade where they have been killed by a thousand cuts. If the next market regime is inflation (CPI at 3-4%), this change in leadership will be the logical outcome, it seems to us. This is key to watch and try and react to.
Gold has historically done well in inflation. On Bloomberg, XAU is a <Crncy> not a <Cmdty>! In other words, it’s a store of value and medium of exchange more than it’s an industrial metal. True, when nothing much is going on in central-bank balance sheets, gold is maybe more a <Cmdty> and less a <Crncy>, but when the proverbial really hits the fan, gold is very much not just a <Crncy>, it’s THE <Crncy>. Indeed, it has been going up with equities during this bear-market surge, despite having just gone up a lot as equities collapsed. This tells you all you need to know about where value ultimately is stored: in something that you cannot print and which literally never tarnishes. The longer the crisis endures, the higher gold will go, in our view. There’s no limit to the gold price when quoted in almost any currency – dollars, euros, yen, pounds … the list goes on and on, and there are going to be so many more of them in issue compared to a virtually entirely static stock of mined gold in the world. We believe the gold price should go up proportionately to the quantum of new money printed.
Conclusion
So, there. We have our market view, updated for the gut-wrenching moves of the last month. Based on our analysis, we believe equities seem to present a valuation opportunity in absolute terms and relative to bonds. Credit appears to be cheap too. All this is contingent on whether the policy response turns out to be adequate, but we are willing to give the benefit of the doubt given how motivated policymakers seem to be.5
1. Since 19 February 2020.
2. This example is intended as an illustration of typical investment considerations and strategy implementation. It takes into account our own estimates and should not be construed as indicative of potential performance of a fund or strategy or of any investment made by a fund or strategy.
3. Source: Moody’s.
4. Source: Morgan Stanley.
5. The financial instruments mentioned are for reference purposes only. The content of this material should not be construed as a recommendation for their purchase or sale.

You are now leaving Man Group’s website
You are leaving Man Group’s website and entering a third-party website that is not controlled, maintained, or monitored by Man Group. Man Group is not responsible for the content or availability of the third-party website. By leaving Man Group’s website, you will be subject to the third-party website’s terms, policies and/or notices, including those related to privacy and security, as applicable.