We have always been excited by free cash flow (‘FCF’) as a tool to aid stock selection within equities. Indeed, we published the results of our empirical work on this as far back as 2001 when still at Morgan Stanley. To borrow a phrase from John Maynard Keynes (as is by now mandatory in all market commentary!) we would venture that the efficacy of FCF strategies for stock selection is ‘one of the most completely established empirical facts’ within the field of factor investing.
In other words, we all know it works. And maybe now that we all know it works, it will stop working – but we doubt it. In this short comment we want to:
- Look at the evidence that FCF works;
- Explore why it works;
- See in which regimes it works and when it doesn’t;
- And finally, speculate about whether or not it might work in an Inflation regime.
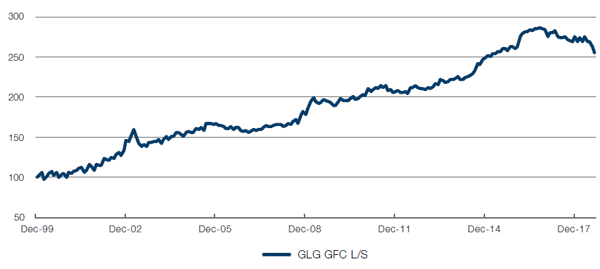
Starting with the evidence that it works, we have used a naïve backtest which creates a portfolio that is long the quintile of MSCI Europe stocks with the highest trailing 12 month FCF yield and short the quintile with the lowest. Figure 1 shows the results – a long short strategy that would have returned 5.4% annualised over nearly 18 years with only two drawdowns worth talking about, of 12% and 10% respectively. We can cite numerous other studies by sell-side firms1 that come to similar conclusions, including ones that use FCF to the firm / enterprise value, and over much longer time horizons than this, and around the world, and all agree that FCF yield strategies work.
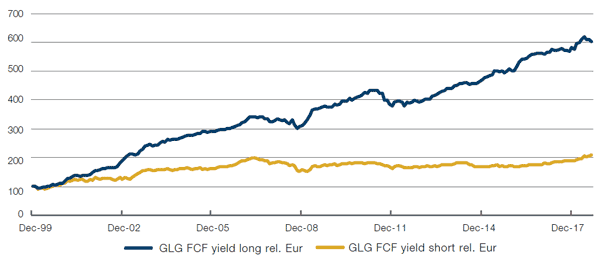
It’s interesting to compare the long leg to the short leg too. In Figure 2 we show these, both relative to the broader market this time. What’s clear is that while the long leg consistently outperforms with two manageable drawdowns (in 2007 and 2011), the short leg does nothing for a decade from end 2007 to 2017 – in short, both legs work as you would hope.2
So it works – but why? Our intuition is that FCF yield has three active ingredients. 1) It’s a measure of value – a cash flow compared to the valuation of the capital base that generated that cash flow. 2) Cash flow itself is a better measure of profitability than earnings as it incorporates the expansion of the economic capital base required to generate it. But 3) and crucially, FCF is the ultimate measure of financial sustainability. A company that generates a lot of free cash is not easily going to go bust.
This third feature is the real secret sauce of FCF strategies – they are at their best in the market’s left tail, when all around them are faltering, when financing is no longer widely available. If the first rule of investing is, or should be, ‘first, don’t lose money’ (cf the Hippocratic oath’s ‘first, do no harm’), then FCF yield strategies fulfill this abundantly. Going back to Figure 1, we would highlight the strong long-short performance between Dec 2000-Mar 2003 (+60% during the TMT crisis); between March 2007-March 2008 (+21% during the Great Financial Crisis); and reasonable performance between Jan-Dec 2011 (+6%, but still, it made money).
When doesn’t it work? There seem to be two general themes for FCF failure. First, at major market inflections up. March-June 2003, as the market first started to recover from the TMT bust, the long short strategy had the first of its two >10% drawdowns. It was a risk-on quarter where banks, with no free cash, led the way simply by pricing out bankruptcy. There was a more moderate 6% drawdown between Oct 2005-Jan 2007 right at the end of the cycle with heavily extended animal spirits and credit spreads very tight still. No need for FCF in such days of plenty! And then latterly, in the last two years since October 2016 to now, there has been the second 10% drawdown for the long short strategy. In a sense this one should be expected as it coincides again with strong animal spirits. But we can’t help noticing that this perfectly coincides with the period of rising bond yields in the US. In summary, FCF seems to work well in the average cycle but doesn’t work in a full-on risk rally out of genuine market stress, and doesn’t work well when bond yields are rising.
Which brings us to our final point. If one takes the view that inflation is going to continually accelerate from here and drive bond yields higher with rising animal spirits, FCF strategies seem unlikely to work well. An inflation regime will benefit companies with pricing power, and those with high levels of fixed rate debt, not necessarily cash generators. If, on the other hand, yields rise because of fiscal unsustainability, Federal Reserve quantitative tightening and capital repatriation to the G7, then in our view, FCF yield should work very well once again.
Figure 1. MSCI Europe, long/short highest and lowest FCF yield quintile portfolios

Source: Man GLG, Bloomberg, MSCI; as of 1 October 2018. Rebased to 100 as of December 1999.
Figure 2. MSCI Europe, Qs 1 and 5 FCF yield relative

Source: Man GLG, Bloomberg, MSCI; as of 1 October 2018. Rebased to 100 as of December 1999.
1. See, for example, Morgan Stanley Research, European Stock Selection – The Factors that Matter, Sharaiha, Funnell, Draaisma et al., December 2002; also BAML, Quantitative Profiles – A PM’s guide to stock picking, Subramainian et al., May 2005. 2. This track record does not represent that of an actual investment product or strategy. It shows a hypothetical portfolio that has been created by back testing a systematic trading model to historic data. Performance is subject to change without notice as models develop over time. A detailed breakdown is available upon request. Example investment charges have not been applied. Simulated past performance is not indicative of future results.
You are now leaving Man Group’s website
You are leaving Man Group’s website and entering a third-party website that is not controlled, maintained, or monitored by Man Group. Man Group is not responsible for the content or availability of the third-party website. By leaving Man Group’s website, you will be subject to the third-party website’s terms, policies and/or notices, including those related to privacy and security, as applicable.