Introduction
What are the merits of allocations to Asia ex-Japan versus emerging markets (EMs) more broadly?
In April 2021, our analysis concluded that there is not much difference between Asia ex-Japan and EM markets when it comes to beta. Where there were differences in beta, they were hard to forecast and time-varying. Instead, we presented some compelling data outlining Asia ex-Japan’s materially deeper, broader alpha opportunity.
Two years on, the world feels like a materially different place: China has reopened following the Covid-19 restrictions; the price of Brent crude has doubled and then halved again; and many EMs in and outside Asia have tightened monetary policy aggressively.
So, much has changed. In that context, and given that we continue to receive questions about beta and alpha in EM and Asia, we are taking the opportunity to revisit our findings.
Beta and Correlation
As of June 2023, the weight of Asia ex-Japan in the MSCI EM Index is almost identical to where it was at the end of 2020: 77% from 79% previously.1 Over that period, a lot has happened to index constituents2:
- China has declined from 35% to 27%;
- Russia has been removed entirely from the index;
- Taiwan3 has increased from 12.7% to 15.5%;
- India has increased from 9.3% to 14.4%;
- The Gulf Corporation Council (‘GCC’)4 has increased from 4.1% to 7.2%, which in aggregate is now bigger than everything other than China, Taiwan, India and Korea.
Little has happened to the correlation of Asia ex-Japan and EM to the MSCI ACWI Index, however (Figure 1). Asia ex-Japan continues to exhibit a lower correlation to ACWI than EM does. We would attribute this to the greater weight in the index in onshore China, where the dynamics driving investment behaviour are independent of the rest of the world. That has become more apparent over the last two years, which probably reflects China’s longer restriction and delayed reopening experience. Broadly speaking, the two indices dance to the same tune, but today, Asia ex-Japan appears to offer a bit more scope for diversification versus global equity beta.
Figure 1. Correlation of Asia ex-Japan and EM to MSCI ACWI
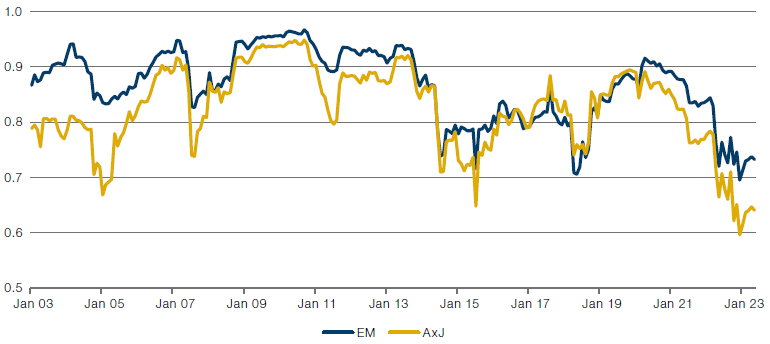
Source: Man Group, Bloomberg; as of 4 July 2023.
In 2021, we argued that the common thread explaining the correlation dynamics shown above between Asia ex-Japan and other EM is the sensitivity to the US dollar. That trend is broadly unchanged (Figure 2).
While both regions follow an almost identical path in terms of trend, the beta for EM ex-Asia is more elevated, reflecting the tendency for larger non-Asian countries to be either resource exporters (Russia, Brazil, Mexico and South Africa) of for many of these countries to run relatively persistent external deficits (Brazil, South Africa, Turkey and Mexico).
Figure 2. Asia ex-Japan & EM ex-Asia: Beta to US Dollar
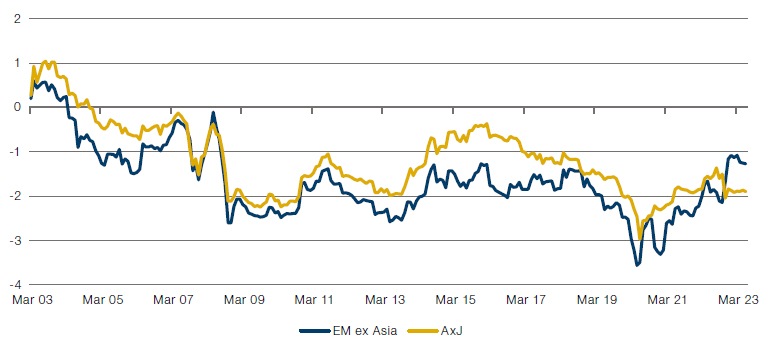
Source: Man Group, Bloomberg; as of 4 July 2023.
Asia is a heterogenous investment universe, however. It is bifurcated into a higher-income, savings-rich, manufacturing north, which enjoys surpluses; and a lower-income south, with many macro similarities to EM ex Asia, namely commodity export-intensity, and/or external deficits. It is our contention that: (1) there is enough variety in the structural macro characteristics in Asia that an investment strategy with sufficient flexibility in country allocations can tilt tactically towards the weaker ‘carry’ economies when conditions are supportive; and (2) the macro similarities of these markets to their counterparts in EM ex-Asia means that the broader attributes of EM can be captured in flexible strategies.
Indeed, the last three years is arguably just such a period of tactical opportunity in the weaker parts of EM and Asia: a weak US dollar post-Covid until mid-2021; a year of booming commodity prices from mid-2021 to mid-2022; and almost 12 months of a weak US dollar from the third quarter of 2022 to date. Over that 3-year period, the broad EM index has delivered mediocre returns, up only 7%. Commodity and carry EM has done much better, with EM ex-Asia up 21% and Asian carry up 37% (Figure 3).
Of course, this is just one episode. But it’s notable that in an environment where commodity producers and weak US dollar beneficiaries have had the room to shine, the bigger gains have been found in the lower income south in Asia than in non-Asian EM.
Figure 3. EM, EM ex-Asia and Asian Carry Returns Post-Covid
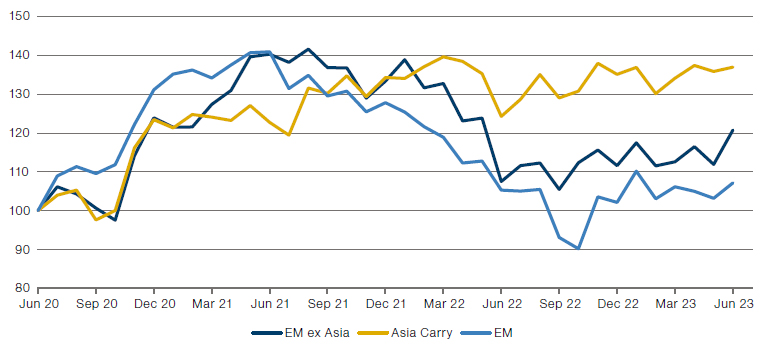
Source: Man Group; Between 30 June 2020 and 4 July 2023. Normalised to 100 as of 30 June 2020.
Revisiting the Alpha Opportunity
All of the above relates to beta and can be summarised as follows: while the non-Asian part of EM is more vulnerable to external conditions, there is enough macro similarity in the Asian south to compensate for the absence of Latam and EMEA when specific conditions – strong commodity prices, or a weak US dollar – arise.
But the real truth of the story is that what matters most is the alpha opportunity, and that alpha opportunities are greatest where there is breadth in independent bets. This is a central tenet in Richard Grinold and Ronald Kahn’s Fundamental Law of Active Management. For liquid public market strategies, we are acutely aware that bets need not just be independent, but sufficiently liquid too.
Figure 4 filters the emerging markets index for companies trading more than USD15 million per day, and then calculates the average pairwise correlation for these stocks. On average, EM ex-Asia has a pairwise correlation weighted by number of stocks at 0.42, versus 0.3 for Asia. Also, the number of liquid stocks in MSCI indices outside Asia is very low: just approximately 100, versus 800 in Asia. Only Brazil has anything approaching a broad investable universe at 44 liquid stocks, but this comes with a lower degree of stock independence than almost anywhere in Asia.
Figure 4. Pairwise Correlation for Stocks > USD 15m Average Daily Value Traded
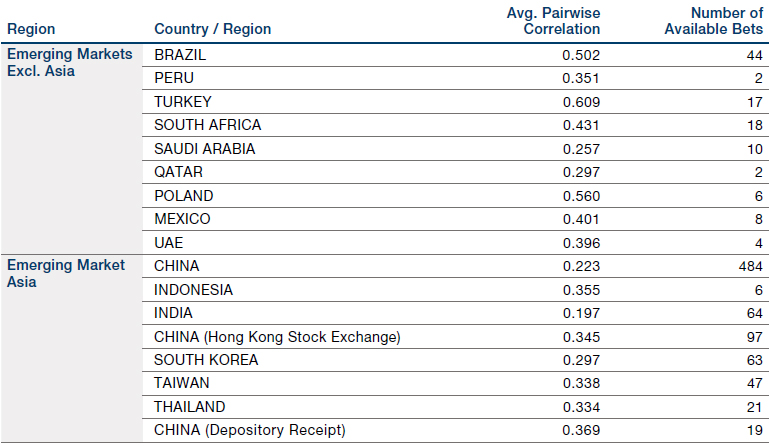
Source: Man Group; as of 3 May 2023.
Conclusion
So, what are the merits of allocations to Asia ex-Japan versus emerging markets more broadly?
Our conclusions from 2021 are unchanged: the best utilisation of our resources is to focus on uncovering differentiated, independent investment opportunities. A small slice of deliberate macro input can materially improve returns at various points in the cycle. But the secret to enduring outperformance is a diversified portfolio.
1. Source: Bloomberg.
2. Source: Bloomberg.
3. Based on the MSCI Country Classification Standard.
4. Economic union comprising Bahrain, Kuwait, Oman, Qatar, Saudi Arabia and the United Arab Emirates.
You are now leaving Man Group’s website
You are leaving Man Group’s website and entering a third-party website that is not controlled, maintained, or monitored by Man Group. Man Group is not responsible for the content or availability of the third-party website. By leaving Man Group’s website, you will be subject to the third-party website’s terms, policies and/or notices, including those related to privacy and security, as applicable.