Introduction
About five years ago, we wrote about the rise of passive investing within the US, which, in our view, was both warranted and not over. Today, we want to revisit that analysis, alongside other notable developments such as the return of retail, the rise of ESG and the resurgence of Value as a (productive) factor.
Passive clearly plays a larger role today than it did five years ago. However, over the last few years, passive market share has plateaued, while retail has picked up the slack. Traditional active managers continue to be pressured, although Value factors have posted solid results over the last year-plus following a difficult decade. ESG considerations could (should?) be having a significant impact on asset prices, but there are so many different approaches to – and definitions of – ESG-investing, that it may be difficult to observe.
In this paper, we try to address the following questions:
- How has the US equity market evolved over the past few years in terms of active, passive, and retail investors?;
- How has the factor-investing landscape changed (including ESG factors)?;
- Is there any evidence of ESG-oriented pricing distortions?;
- How has the Value opportunity developed?
We continue to believe there is a place for both passive and active investing. We also believe Value will be more relevant over the next decade than it was over the last decade, although likely not as relevant as it has been over the last six quarters. Lastly, the role of ESG in investing will change in ways that are difficult to anticipate today, and it will be important for both passive and active strategies to learn and adopt to an ever-changing environment.
US Equity Market Landscape
In our previous article, we laid out a framework for identifying passive managers by examining 13F filings to find those firms that had very low active share. We acknowledge that there are a number of assumptions and limitations to this approach, many of which we have outlined in our previous article. At the time, the three largest managers, and four of the largest 10, were mostly passive players.1 Today, the picture is quite similar (Table 1), although the numbers are much larger! Now, five of the largest 10 13F filers are mostly passive, while the other five have an estimated active share of 33% to 55%.
Table 1. The 10 Largest 13F Filers of Russell 1000 Securities2
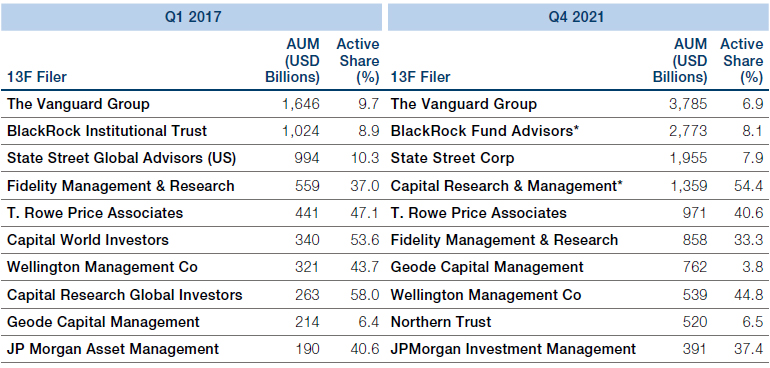
Source: Man Numeric, Russell, Factset; as of December 2021. The organisations and/or financial instruments mentioned are for reference purposes only. The content of this material should not be construed as a recommendation for their purchase or sale.
We classify managers as ‘active’ if they have an active share above 20% and ‘passive’ if they have an active share below 20%. This is an arbitrary threshold, but we believe gives us a sense for firms that are primarily passive versus those that are at least somewhat active. We then estimate the relative market share of active and passive managers; one issue, though, is that it excludes the presence of retail investors and the rise of DIY-investing. To account for this, we now estimate retail ownership as the percent of market cap not owned by active and passive investors.3 Over the last five years, it appears that passive investors have continued to gain market share, though almost exclusively at the expense of active investors (Figure 1). Interestingly, the rise of passive has stalled at around 30% over the last two years, while retail has shown a small positive change.
Figure 1. Estimate of Active, Passive and Retail Ownership Within Russell 1000 Securities
Problems loading this infographic? - Please click here
Source: Man Numeric, Russell, Factset; as of December 2021.
Our methodology does have a shortcoming where large founders or similar entities (like private equity firms) that do not file 13F filings are counted as ‘retail’ investors, although they are clearly not. In Figure 2, the cap-weighted ‘retail’ ownership is substantially higher than the average or median stock, which is likely more reflective of actual retail participation. While the reduction in retail activity appears significant during the 2000’s, and continues down during the 2010’s, one can see a rebound in retail participation beginning in 2020. This clearly warrants monitoring on an ongoing basis, and we hope to further refine this analysis to consider large investors not subject to 13F filing requirements.
Figure 2. Large-Cap Retail Ownership (R1000 Constituents)
Problems loading this infographic? - Please click here
Source: Man Numeric, Russell, Factset; as of December 2021.
A few case studies may help us understand the interaction between active, passive and retail investors, as well as highlighting some of the issues with this approach. Figure 3 shows our estimate of cohort ownership for Tesla (which perhaps a few of you are familiar with). The most obvious shortcoming here is that because Elon Musk does not file a 13F, he is lumped into the retail category below, which is… suboptimal. That being said, it does appear that retail has been a net buyer of Tesla over the last several years, which is probably not surprising. Active investors have been net sellers over the last few years, while passive investors have slowly accumulated Tesla, and a small spike (from 16% to 22%) is apparent in the fourth quarter of 2020, when Tesla was added to the S&P 500 Index.
Figure 3. Estimate of Active, Passive, and ‘Retail’ Ownership of Tesla
Problems loading this infographic? - Please click here
Source: Man Numeric, Factset; as of December 2021. The organisations and/or financial instruments mentioned are for reference purposes only. The content of this material should not be construed as a recommendation for their purchase or sale.
Another interesting example to showcase the return of retail investors is GameStop (Figure 4). Who can forget the craziness that ensued as the Reddit crowd bought GameStop and related derivatives? One issue here is how we are calculating retail ownership; as mentioned above, we estimate retail ownership as the percent of market cap not owned by active and passive investors. In cases where the sum of active and passive investors exceeds the market cap, which can occur legitimately because of shorting activity, we truncate the sum to 100%, which forces our estimate of retail ownership to be zero. This is again suboptimal, but is done as a safeguard to potentially problematic data. Hence Figure 4 is a bit misleading, in that retail owned some GameStop all along, but it is telling that there is a huge spike in retail ownership in the first quarter of 2021 as the event unfolded (and professional investors, both active and passive, sold). In untruncated terms, active and passive holders went from owning 108% of GameStop market cap as of the end of 20204 to only 37% of GameStop market cap by the end of the first quarter of 2021. In fact, professional active investors held almost no GameStop.
Figure 4. Estimate of Active, Passive, and Retail Ownership of GameStop
Problems loading this infographic? - Please click here
Source: Man Numeric, Russell, Factset; as of December 2021. The organisations and/or financial instruments mentioned are for reference purposes only. The content of this material should not be construed as a recommendation for their purchase or sale.
The market-weighted active share in the Russell 1000 has continued to fall, from c.40% five years ago to 35% today, indicating an increasingly passive market.
In our prior article, we also estimated market-weighted active share (‘MWAS’), which attempted to identify how active or passive all market participants were collectively. If all market participants are passive, active share will approach zero, while a market of entirely active managers will have an active share much closer to 100. The beauty of this approach is it accounts for active managers who have become increasingly passive.
Figure 5 illustrates how this has evolved over the last several years. Just as we have continued to see the rise of passive investors, MWAS in the Russell 1000 has continued to fall, from roughly 40% five years ago to 35% today. That rate of change is similar to what occurred over the prior 10 years, and indicates an increasingly passive market. Within the Russell 2000, managers are much more active, though still significantly less so than was the case historically.
Figure 5. Market-Weighted Active Share
Problems loading this infographic? - Please click here
Source: Man Numeric, Russell, Factset; as of December 2021.
Factor Investing Landscape and Considerations
The ‘Value + Momentum’ style – which has historically been central to a number of systematic equity strategies – has essentially disappeared.
We can also use this data to identify managers with consistent styles at the firm level. As passive has continued to gain market share, managers with distinctive style biases are likely to have lost market share. Our approach involves calculating the 12-quarter rolling z-score of each active manager’s5 exposure to a particular factor and looking at firms whose z-scores exceed 1.5 in combination with an average active exposure of more than 0.1.
Figure 6 shows the results using a variety of Barra factors.6 As expected, we see generally declining market share across these styles, with Growth still having the highest market share.7 One potential implication of that is that retail tends to be more Value oriented (Tesla and GameStop notwithstanding). It is also interesting to see that the ‘Value + Momentum’ style – which has historically been central to a number of systematic equity strategies – has essentially disappeared. We believe this is an accurate reflection of the landscape we are operating in.
In addition, we attempt to estimate the market share of low beta managers, given the challenges in that space and the stumble of one or two higher profile managers that utilise the approach. Unfortunately, the data is not particularly helpful, as it appears that the low beta style essentially has no market share from 2008 onwards! We do not believe this is the case, but rather a function of the challenges involved; in particular, our focus on the entirety of a firm’s investment holdings rather than specific investment strategies.
Figure 6. Estimated Market Share of Certain Style Managers
Problems loading this infographic? - Please click here
Source: Man Numeric, Barra, Factset; as of December 2021.
We also attempt to identify managers that have a consistently positive (or negative) exposure to ESG investing. Using the same rolling z-score approach but with the MSCI ESG score, we find evidence that many managers appear to have consistently positive or negative ESG exposure. While there is not really a noticeable trend here, there is one exception: over the last several quarters, the market share of high- and low-ESG managers has converged, and for the first time, high ESG managers have a (slightly) higher market share (Figure 7). But because ESG is also a more recent development, we also use a ‘Spot’ approach where we look at firms with high (>0.15) or low (<-0.15) active exposure for the current quarter. Here, we see a similar outcome, although there has been a more recent reduction in firms that have fairly negative ESG exposure. Altogether, while this does not confirm the increasing emphasis on ESG in the investment landscape, it does suggest that many managers are not (solely) relying on this particular input.
Figure 7. Estimated Market Share of High and Low ESG Managers
Problems loading this infographic? - Please click here
Source: Man Numeric, MSCI, Factset; as of December 2021.
With all the money flooding into ESG-oriented strategies8, one might expect this to manifest itself in an increasing ESG ‘premium’. Anecdotally, it does appear there are stocks benefiting from an ESG tailwind. However, at the broad market level, that doesn’t appear to be the case. Figure 8 shows the times-series cross-sectional correlation between MSCI and Sustainalytics ESG score against both Man Numeric’s compositive Value alpha and the Barra Book/Price factor. While this is a particularly short history, there does not appear to be any trend where ESG is getting more expensive; if anything, the relationship suggests ESG has been getting slightly cheaper.
Figure 8. Value Correlations With Raw MSCI and Sustainalytics ESG Scores
Problems loading this infographic? - Please click here
Source: Man Numeric, Barra, MSCI, Sustainalytics; as of December 2021.
Figure 9 shows the same relationship between Man Numeric’s ESG composite, climate composite, and the E, S, and G subcomponents against the Barra Book/Price factor. While it appears that these models are all slightly expensive on a book-to-price basis, it does not appear to be significantly so. Indeed, again over the last year, there seems to be an upward slope, suggesting these alphas may be getting a bit cheaper. Honestly, given the amount of money that is purported to have moved towards ESG-oriented strategies, it is interesting that there has not been a notable repricing over time. This is likely to be attributable to the lack of agreement on what exactly ESG is and how it is best implemented.
Figure 9. Man Numeric ESG/Climate Correlations to Barra B/P
Problems loading this infographic? - Please click here
Source: Man Numeric, Barra; as of 28 February 2022.
Another important consideration in the US investing landscape is the potential opportunity in the Value trade. After the Value rally of the last six quarters (roughly), it is worth asking if the trade has run its course. No single metric could possibly answer that question, but our preferred view of valuation stretch (Figure 10) suggests that while the opportunity has shrunk recently, it is still very wide by historical standards, and almost certain to collapse further.9
Figure 10. US Top 1000 Industry-Adjusted Value Stretch
Problems loading this infographic? - Please click here
Source: Man Numeric; as of 28 February 2022.
Conclusion
Over the last several years, the US equity market has grown as a portion of global public equities; today, the US represents a 60% weight in the MSCI All Country World Index. Given the pandemic, the return of retail and the increasing significance of ESG concerns, we were curious how much had actually changed across the landscape. While the rise of passive has slowed over the last few years, we still believe it has room to grow; 30% does not seem like an upper limit, practically or theoretically, to passive market share. It is difficult to predict what will happen to retail, though it is unlikely that the more speculative components can survive indefinitely.
And then there is ESG, which we all know is there, but is still a bit hard to quantify its direct impact on the investment landscape, likely because of its heterogeneity. That being said, we expect a few things in the ESG arena: (1) it will continue to evolve at a rapid pace and may look quite different a few years from now than it does today; and (2) the worlds of passive and ESG investing will become increasingly blurry as investors seek to express their personal or professional preferences in an efficient manner. While many of us have spent decades trying to model and understand company financials and projections, it is still relatively early days on the ESG front. We find it interesting that up to this point, it is not obvious that the advent of ESG has had a material impact on asset pricing, at least per our attempts to quantify.
Value is an area where we still do see an outsized opportunity.
Lastly, on the factor investing front, it is interesting to see that the market share of Value investors is at roughly a 2-decade low, though perhaps we should not necessarily expect a rebound if passive does continue to garner market share. It is also interesting, but not surprising, to see that traditional ‘Value + Momentum’ investors have essentially disappeared. Scanning the landscape of opportunities across factors, while some of the easy money10 has been made in Value, it is an area where we still do see an outsized opportunity, although less so than a year or so ago. The big risk to value is probably a recession or move in interest rates back towards zero (those two would probably not be independent events). The current environment of high inflation and rising interest rates should continue to favor low duration assets over high duration assets, contrary to what some FOMO/retail investors believe…
1. For this purpose, we are focusing on Russell 1000 constituents, not the total US stock market.
2. Indicates that multiple 13F subsidiaries were aggregated across relevant subfilers.
3. We will come back to a few issues with this approach.
4. Again, over 100% because of the presence of short selling.
5. Defined as active share > 20% and holdings > 50.
6. For Value, we are combining Barra B/P, E/P, and D/P. Val + Mom is a 50/50 combination of each.
7. In fact, it appeared to rise in 2019 and 2020 before falling again more recently.
8. Which we still believe to be the case, prior figure notwithstanding.
9. Although note this could happen both because of revaluation, which would be good for Value, or changes in fundamentals, which would be bad for Value.
10. Ok…actually not easy after the experience of the 2010’s and first quarter of 2020…
You are now leaving Man Group’s website
You are leaving Man Group’s website and entering a third-party website that is not controlled, maintained, or monitored by Man Group. Man Group is not responsible for the content or availability of the third-party website. By leaving Man Group’s website, you will be subject to the third-party website’s terms, policies and/or notices, including those related to privacy and security, as applicable.