Introduction
One of the biggest trends in asset management over the last several years has been the acceleration of flows out of active equity strategies, and nowhere has this trend been as pronounced as in US equities. Many of these assets have flowed into passive and smart beta investments due to a combination of lower fees and performance difficulties among many active managers. But as this significant shift is occurring, it is important to try to understand the underlying dynamics:
- How much of the shift has occurred? How much may be left?
- What is the source of passive flows?
- How can publicly available data be used to analyze individual managers?
- How should society think about the appropriate balance between active and passive approaches?
While it is impossible to answer these questions with precision, we will try to draw some conclusions by analyzing 13F filings where US equity managers report equity holdings on a quarterly basis1. We believe that the move from active to passive is likely to continue, that much of this flow has been driven by a reduction in growth investing, that it is possible to estimate the passivity of an asset manager over time, and that there is a place for both passive and active investing in the future.
Quantifying the shift from Active to Passive
Several research and investment firms have attempted to quantify the market share of passive investors, but determining the exact amount is an almost impossible task. The current consensus is that a significant amount of US equities are managed passively, but likely still less than half of the overall market2. There are several reasons why it is difficult to pinpoint a precise breakdown of active and passive assets. First, many of the largest passive managers (Vanguard, BlackRock, etc) also sell active strategies. Second, what exactly is a passive strategy? Clearly a fund tracking the S&P 500 Index is a passive strategy, but what about a fund tracking the S&P Financial Index? What about a fund tracking the MSCI Low Volatility Index? Many smart beta strategies passively track indices which have been created to gain exposure to a particular factor. We will make two independent attempts (detailed below) to quantify the shift to passive, both relying partially on the notion of active share.
Active share is the proportion of a portfolio’s holdings that differ from the benchmark3. In other words, a passive strategy will generally have an active share of very close to zero. An active share of 100% would indicate the strategy held no benchmark components. We can define the active share (AS) of manager i as the following:
The active share for a particular manager is the sum of the absolute value of the active weights divided by 2 (to obtain a number between 0 and 1). We can apply this formula to each manager that files a 13F to attain an estimate of their active share. To do so, we have to make a significant assumption here4 which is that all managers in the US are benchmarked to the Russell 1000® and Russell 2000® Indices. We make this assumption for several reasons. First, it allows us to get ‘full’ coverage of the US equity universe (whereas the S&P 500 Index covers a much smaller set of stocks.) Second, it simplifies the analysis in a world where many managers may be more value or growth tilted, either actively or passively. For example, if a firm’s largest product is benchmarked to the Russell 1000® Value Index, our estimate of active share is likely to be biased upwards because we are comparing the weights to the Russell 1000® Index. On a case-by-case basis, it is possible to address this bias, but across hundreds of managers over dozens of quarters, it becomes much more difficult. Table 1 displays the largest current holders of Russell 1000® and 2000® equities, as well as our estimate of their active share; intuitively several of the largest asset managers have a significant passive bent.
Table 1. 2017Q1 Largest Managers (AUM in USD millions)5
| Russell 1000 | AUM | Active Share |
|---|---|---|
| The Vanguard Group | 1,645,724 | 9.7 |
| BlackRock Institutional Trust | 1,023,536 | 8.9 |
| State Street Global Advisors (US) | 993,529 | 10.3 |
| Fidelity Management & Research | 558,978 | 37.0 |
| T. Rowe Price Associates | 441,190 | 47.1 |
| Capital World Investors | 340,539 | 53.6 |
| Wellington Management Company | 321,139 | 43.7 |
| Capital Research Global Investors | 262,502 | 58.0 |
| Geode Capital Management | 213,836 | 6.4 |
| JP Morgan Asset Management | 190,330 | 40.6 |
| Russell 2000 | AUM | Active Share |
|---|---|---|
| BlackRock Institutional Trust | 171,066 | 14.3 |
| The Vanguard Group | 164,065 | 13.0 |
| Dimensional Fund Advisors | 65,699 | 33.7 |
| Fidelity Management & Research | 55,562 | 61.4 |
| State Street Global Advisors (US) | 54,374 | 16.8 |
| T. Rowe Price Associates | 34,228 | 65.9 |
| Wellington Management Company | 29,791 | 64.9 |
| Northern Trust Investments | 25,858 | 11.5 |
| TIAA Global Asset Management | 17,908 | 30.0 |
| Geode Capital Management | 16,570 | 9.0 |
Source: Man Numeric, Russell, Thompson/Reuters.
We can now use our active share estimates to produce two distinct estimates of the shift from active to passive. The first approach is to identify passive managers as those that have low levels of active share (e.g., less than 20%), and then aggregate the ownership of those passive managers. Figure 1 displays our estimate of index ownership in the Russell 1000® and Russell 2000® Indices over the last 20 years. There has been a clear and substantial shift towards indexing, with passive investing in large caps roughly tripling (from 8% to 24%) and in small caps rising even further (from 4% to 25%). Two additional points are worth making here. First, it appears that this trend has accelerated over the last year, especially in small caps, coincident with the struggles of many active managers. Second, and perhaps more alarmingly for active managers, passive ownership appears to have room to grow. It is entirely possible to imagine a world where 50% to 70% of the market is passively owned, and we are not even close to those levels.
Figure 1. Estimated Passive Ownership within R1000/R20006
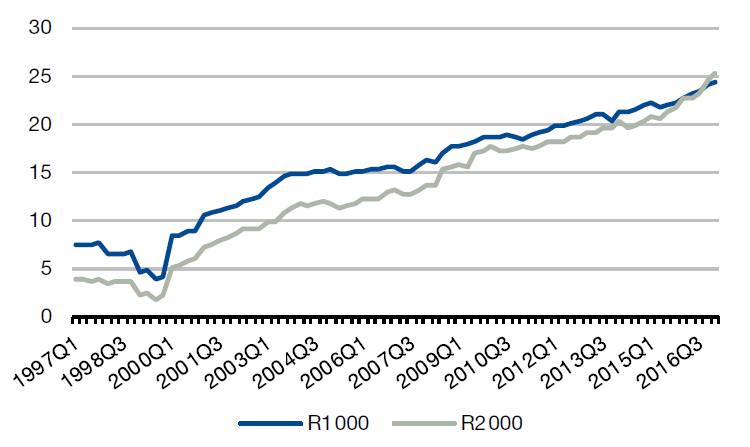
Source: Man Numeric, Russell, Thompson/Reuters.
As we alluded to earlier, one of the issues with this approach is it is quite binary: an asset manager is categorized as either active or passive. An alternative approach that theoretically addresses this shortcoming is to look at aggregate active share of the market. In a world where all investors are passive, the aggregate active share would be zero. Assuming active investors only hold benchmark names, a highly active market could have an aggregate active share in the 80% to 90% range. By looking at the aggregate active share across market participants, we can gain some insight on whether managers are becoming more or less homogenous. Higher (or lower) levels of aggregate active share indicate less (or more) homogeneity. Increased homogeneity should raise systematic risk as this represents a form of crowding.
Figure 2 displays the aggregate active share7 within the Russell 1000® and Russell 2000® Indices. Even though our prior methodology estimated only about 25% passive ownership of large caps, the aggregate active share in large caps is fairly low at about 40%. Surprisingly, while active share fell from 1998 to 2001, it has not fallen over the last 15 years. Given the increase in passive investing, it is unclear why aggregate active share has not fallen. Possible explanations are flaws in our assumptions, the impact of relatively skewed benchmark weights, or a reduction in ‘enhancedindexing’, which fell out of favor after the TMT bubble. The decrease in active share in small caps has been more pronounced, dropping from approximately 80% to approximately 58%. A potential concern to active small cap investors is the prospect for active share to fall even further.
Figure 2. Estimated Asset-weighted Active Share within R1000/R2000
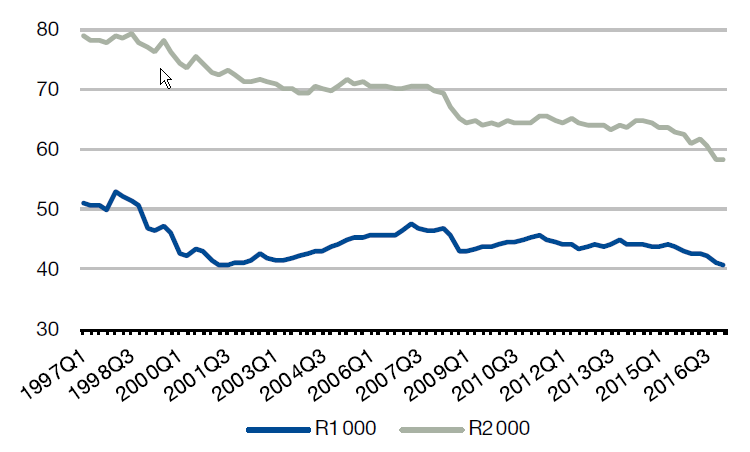
Source: Man Numeric, Russell, Thompson/Reuters.
While it is clear that a massive shift is underway, and may have accelerated recently, this gives little insight into how much further there is to go. That being said, we think it is likely that the flow from active to passive investment strategies will continue.
Smart Beta: The passively active strategy
Thus far, we have focused on passive strategies and active share. However, the rise of smart beta has produced a variety of strategies that share characteristics with both active and passive strategies. Smart beta strategies are active in that they deviate from market capitalization weighted indices by design. But many are implemented in a passive fashion, following relatively static rules for portfolio inclusion, weighting, and rebalancing. The promise of these strategies is they purport to access the components of an active strategy that could deliver alpha, but at a fee much closer to that of a passive strategy. One could question whether or not smart beta is truly ‘new’; for example the Russell 2000® Value (passive) Index is essentially a smart beta play on value and small caps. Putting that aside, there is no question that smart beta strategies have become more popular over time, accessing themes such as value, momentum, defensive, quality, and low volatility.
1. See Appendix A for description of 13F data.
2. Bernstein estimates that 14% of US market cap is held passively, or ~45% of ETF and mutual fund assets. “Fund Management Strategy: Nearing the 50% passive milestone.” April 25, 2017; Financial Times estimates 1/3 of market is passive. https://www.ft.com/content/4cdf2f88-7695-11e6-b60a-de4532d5ea35. Outside the US estimates are even harder to come by, but with the exception of Japan, passive investing is believed to be smaller than it is in the US.
3. For more information, see the Man Numeric white paper: “Active Share – Is there more to the story?” December, 2014.
4. We actually make several assumptions. Another assumption is that we exclude holdings outside our chosen benchmarks; this may lead to an underestimate the true active share.
5. Based upon manager 13F filings as of 31 March 2017.
6. Based upon data pulled from quarterly 13F filings since 1997.
7. Aggregate active share is calculated as the asset-weighted active share among asset managers in Russell 1000® and Russell 2000® Indices’ equities.
8. There are 462, 212, 357, and 170 managers that fit the criteria for Value, Momentum, Growth, and the blend.
9. The z-score is calculated as the average exposure to a factor divided by the standard deviation of the exposure.
You are now leaving Man Group’s website
You are leaving Man Group’s website and entering a third-party website that is not controlled, maintained, or monitored by Man Group. Man Group is not responsible for the content or availability of the third-party website. By leaving Man Group’s website, you will be subject to the third-party website’s terms, policies and/or notices, including those related to privacy and security, as applicable.