Introduction: Trends Can Lead to Entrenched Correlation Estimates
Before the tragic developments in Ukraine, markets had spent much of the start of the year focused on the path of inflation and its relationship with oil and interest rates. The literature shows that historically, when inflation has increased, strategies have often benefitted from being passively long energies or trend following bonds.1 As annual CPI in the US reached 7.5% earlier this year, we saw that play out: 10-year US Treasuries dropped as yields trended higher by 48 basis points, oil prices hit levels not seen since 2014 and market estimates of the probability of a 50 basis-point rate hike in March by the Federal Reserve reached a peak of 94%.2
As a result, traditional backward-looking estimates of the correlation between changes in prices of Treasuries and oil have stayed consistently negative; i.e., when oil prices have gone up, Treasury prices have fallen. Figure 1 shows the correlation estimates3 for Brent crude oil futures and 10-year US Treasury futures as of 23 February i.e., the day before the invasion of Ukraine. Although the magnitude of the correlation varies, the negative relationship doesn’t.
Figure 1. Oil and Treasury Futures Price Correlations
Problems loading this infographic? - Please click here
Source: Man Group; as of 23 February 2022.
What about if we had exponentially weighted the returns? As noted here, depending on the desired properties of your correlation estimates (say, stability versus responsiveness), it may be appropriate to more heavily weight recent returns than older ones when calculating such estimates. But, in this case, the result is the same: for a range of different half-lives and n-day rolling returns, the backward-looking correlation estimate as of the day before the invasion was again consistently negative (Figure 2).
Figure 2. Oil and Treasury Futures Price Correlations – Exponential Weights
Problems loading this infographic? - Please click here
Source: Man Group; as of 23 February 2022.
But Correlation Estimates Aren’t Always Representative and May Increase Risk
On the day of the Russian invasion, the prices of both US 10-year Treasury futures and Brent crude oil futures increased. Day-on-day changes reached a high of USD1.06 and USD8.95, respectively, before their subsequent partial retrenchment. As Treasuries are regarded as a safe haven and Russia is the world’s second-largest oil exporter, it was not necessarily surprising prices increased, but such a rise is contrary to traditional estimates of prevailing correlation structure.
This is important because when a negative correlation between two assets is used as an input in measures of portfolio risk, short positions in those assets may be treated as partially offsetting. Hence, if an investor was short both 10-year US Treasuries and Brent crude on the day before an invasion, their portfolio would have been estimated as having less risk than was actually the case. What is more, if that same investor had previously used those estimates of correlation to determine the leverage of their portfolio, they would have seen greater losses than they otherwise may have.
The example of Treasuries and crude oil is perhaps intuitive. But for other events or different asset classes, predicting the correlations of market moves may be more challenging. Yet, to get an appropriate assessment of risk, we still need to try.
So How Can Estimates Be Made More Realistic?
A simple but potentially more realistic approach to estimating future portfolio event risk requires being more selective over which days to include in the sample of returns for a correlation estimate.
For example, suppose that in the days before war was declared, the above investor had wanted a better estimate of forward-looking correlations for their risk model. If they had narrowed in on specific days where news reports indicated possible escalation or de-escalation of the crisis, they could have reached a positive correlation estimate for Treasury and oil futures. This is shown by the yellow line in Figure 3. By ignoring ‘other’ days, which are as not representative of what would happen in the case of war, the investor may have gained a better forecast for the risk they were taking.
Figure 3. Day-on-Day Price Changes – Escalation/De-Escalation Days Versus ‘Other’ Days
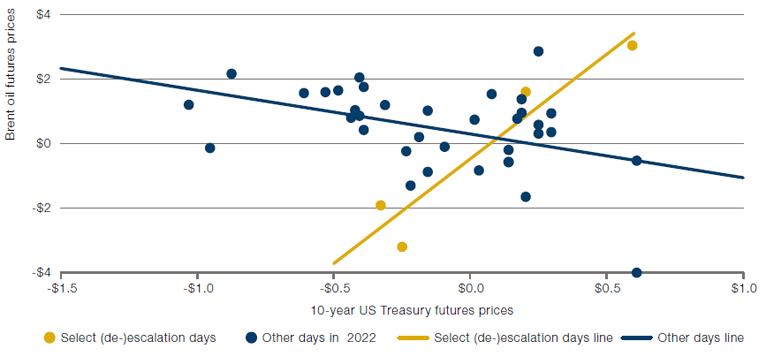
Source: Man Group; as of 25 February 2022.
Identifying representative days can take several forms. It could be done statistically (for example in this case by filtering on days where Russian assets experienced large moves) or manually by picking out dates based on news-flow and intuition – as was done in our example. Either way, the goal is to have the returns in your sample to be as representative as possible of the range of reasonable outcomes should the event occur.
Conclusion: Challenging Assumptions
For portfolios with multiple assets, correctly assessing correlations can be just as – or even more – important than estimating the absolute size of market moves. The Russian invasion of Ukraine provides a case study of this principle: by challenging the assumptions of traditional correlation estimates and being more selective regarding the returns used to estimate correlations, a more accurate understanding of likely market moves during a crisis can be achieved. This, in turn, allows investors to gain a better understanding of the risks their portfolios may face – and ultimately allow them to position themselves better during crisis events.
1.www.man.com/maninstitute/when-inflation-hits
2. Sources: CME, Man Group, Bloomberg. Year-to-date moves as of 23 February.
3. We use the Pearson correlation coefficient with a range of different lookbacks and n-day rolling returns.
You are now leaving Man Group’s website
You are leaving Man Group’s website and entering a third-party website that is not controlled, maintained, or monitored by Man Group. Man Group is not responsible for the content or availability of the third-party website. By leaving Man Group’s website, you will be subject to the third-party website’s terms, policies and/or notices, including those related to privacy and security, as applicable.