It’s been another bumper results season that has driven markets from Tokyo to New York and Istanbul to new heights. While expectations of imminent rate cuts have moderated from what had been priced in at the tail end of last year, the bad surprises on the inflation front seem to be receding. This is stoking hopes for an easing of monetary policy later this year.
At the same time market rallies (particularly if they appear to rest on a narrow set of stocks such as the Magnificent Seven) are a recipe for anxiety about how sustainable they really are. Doesn't it appear too good to be true?
Understanding the drivers of returns in previous market regimes can help investors to project history forward and maximise the probability of successfully capturing alpha. That is where machine learning can help. Our MacroScope algorithms look back into history for similar regimes and see how risk factors and industries performed during those periods to glean insight about how the future will play out.
Our Unsupervised MacroScope algorithm uses machine learning to find similar regimes with little human oversight while our Supervised MacroScope algorithm adds human labelling of the macroeconomic timeseries to help us shift more weight to the strongest relationships.
By looking at similarity measures (Figure 1) we can uncover which periods we are most similar to in history. So what do history and the models tell us?
The good news is that the future looks bright as we are in a regime most similar to periods of strong growth, and most dissimilar to the period on the eve of the Great Financial Crisis (GFC). Our most similar month is June 1997 and other months in the period of strong economic growth in the late 90s. Our least similar month is July 2008, with worsening financial conditions and the unwinding of the subprime mortgage crisis that led to the eventual collapse of Lehman Brothers in September of 2008.
Figure 1: We are closest to the late 90s boom period
Problems loading this infographic? - Please click here
Source: Bloomberg, Man Numeric
Our two models have a similarly positive view on momentum, but diverge on the extent of the risk-on sentiment.
Unsupervised Macroscope (Figure 2) appears risk-on, as it’s very much pro-momentum and tilts toward growth and small caps (size). Conversely, it is short low volatility (residual volatility) and earnings yield, moving it away from usual areas of safety in volatile markets.
Figure 2: Risk-on styles dominate current market
Problems loading this infographic? - Please click here
Source: Man Numeric using MSCI Barra Factors
Supervised MacroScope (Figure 3) shows equally strong momentum, but is balanced with more conservative positioning of long low volatility (residual volatility) and low beta (beta), as well as short illiquid (liquidity) and small cap (size) names.
Figure 3: Momentum is still strong but tempered by more cautious positioning
Problems loading this infographic? - Please click here
Source: Man Numeric using MSCI Barra Factors
Having uncorrelated models that offer different perspectives is ideally the key part of any investment process in order to create diversified return streams and expand capacity in trading.
Unsurprisingly, for industries, our MacroScope model has positioned itself around areas of fast technological growth - Software and Semiconductors mirroring the main drivers of the current stock market rally. Conversely, the MacroScope is short on raw commodities such as oil and gas, gold and steel reflecting the backdrop of weak oil and declining inflation.
Figure 4: Our model picks tech which mirrors the drivers of the current market rally
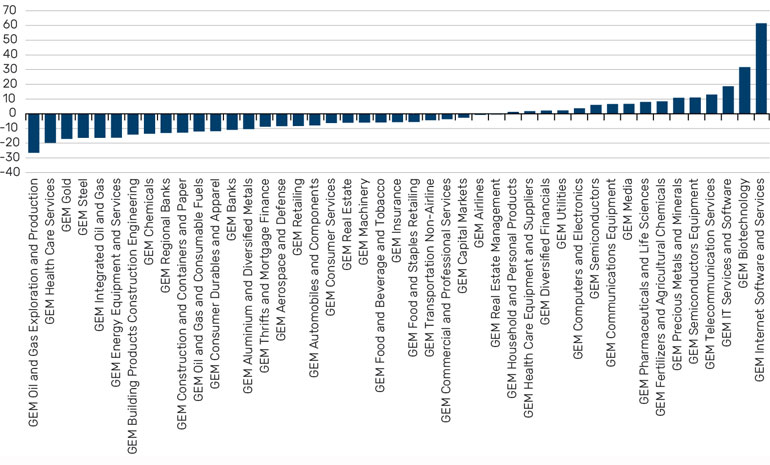
Source: GICS
To sum up, while any rally will eventually either run out of steam or gets cut short by a black swan event, barring the latter, the signals right now show there is plenty of juice left in the tank.
Investors Still Chase Growth, Smart Money Seeks Diversification
Institutional investors are looking for ways to lessen their portfolios’ dependence on economic growth, increase diversification and provide downside resilience.
During the 13 years post the Great Financial Crisis (GFC), monetary policy was accommodative and interest rates remained low to stimulate the US economy and prevent a deflationary spiral.
Access to cheap debt financed corporate growth and fuelled equity market rallies. Low rates led to investors taking leveraged bets and allocations to longer term, illiquid investments such as private equity and real estate, grew.
That means low rate and economic growth risk permeated many institutional portfolios. Technology stocks, early-stage venture, large-cap buyout and real estate investments with low cap rates are just a few examples of these investments that could be vulnerable in today’s higher rate environment.
The seeming diversification in many institutional portfolios could prove to be over exposure to this one low-rate factor.
Figure 1: Rolling 12-month private capital fundraising activity
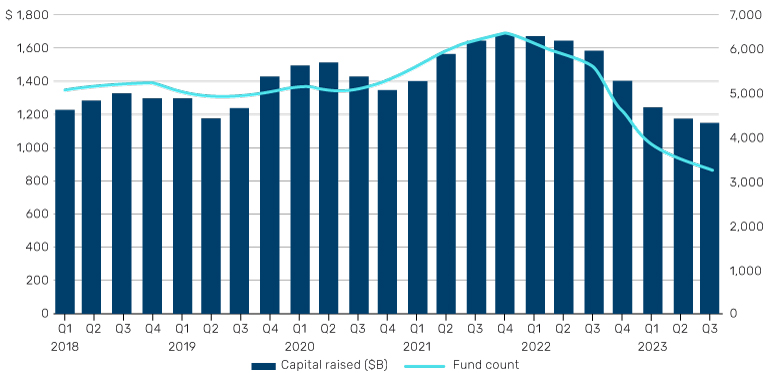
Source: PitchBook Data Inc1
In public equities, the long-term decline in the number of listed companies is notable. In 1996, there were over 8,000 publicly listed companies traded on US exchanges compared to just 3,700 in 2023.2
Concerns about the breadth of opportunities in public equities have returned in the past year thanks to the dominance of the Magnificent Seven tech stocks – which many see as a deflationary bet that AI will spur economic growth – and which drove more than 50%3 of the returns of the S&P 500 Index, making active management exceptionally difficult. This occurred after bonds failed to protect portfolios in 2022, falling alongside equities and challenging its traditional safe-haven, diversifier role. These developments have underscored a growing belief that the current allocations models need to be revisited and their assumptions on asset class diversification re-examined.
Diversification across liquidity spectrum
Increasingly, institutional investors are viewing their diversification across the liquidity spectrum rather than segregating long-only, hedge and private market investments. In equities, this change in sentiment reflects the further need to evaluate investment risk factors across the liquidity spectrum. It also recognises that much market activity is now occurring in private markets, an area of significant growth and importance, even for public market investing.
This is already being reflected in the new allocation trends in alternatives. While PE allocations moderated overall in 2023, venture capital fundraising declined 60% while buyout fundraising was more resilient4.
Within buyout, investors favoured the middle market PE in order to reduce their leverage because this segment historically has presented more favourable valuations and idiosyncratic opportunities.5
Fundraising in this sector was highly elevated at 64% of all PE funds closed in 2023 by count, in comparison to the average 10-year average of 50.1%. It’s important to note that while allocators initiated this pivot in 2023, deployment strength is tenuous as investors are cautious given that PE buyout multiples saw declines in 2023 after a decade of a higher multiples environment where managers were able to sell at highs.6
Hedging with credit
Investors are looking to diversify their exposure across the credit liquidity spectrum.
A recent Barclay Strategic Consulting survey of hedge fund investors reported that credit hedge strategies such as credit long/short and distressed was the most popular strategy in 2023, and credit multi-strategy and convertible arbitrage gained interest as well as other diversifying strategies such as stat arb, equity market neutral and Fixed Income Relative Value7.
In private credit, investors have increased their exposure as well. The emergence of this asset class traces its roots to providing junior debt in conjunction with leverage buyouts. It evolved and expanded to fill the lending gaps left by regulatory constraints and bank consolidations post the 2008 Global Financial Crisis.
It is a newer sub-strategy within institutional investors’ portfolios and generally is a smaller and less developed allocation. With the growth and maturity of this asset class, institutional investors are turning to it as a new source of attractive returns. The current yield, floating rates and the senior position in the capital structure are all attractive characteristics in today’s market, offering potentially greater diversification to their broad portfolios.
Tougher regulation on the horizon
Turmoil in the banking sector in 2023 led to further bank retrenchment in traditional lending activity. As a result, private credit managers were able to step into that space and the opportunity set broadened. Given the growth of this new segment of the lending spectrum, financial regulators have noted the difficulties with transparency among some private credit funds and its impact on their ability to assess the potential risks in the sector. The regulatory backdrop is therefore another unknown which is important to monitor in the sector. Regulation will likely increase, which may result in changes in the execution and management of private credit portfolios.
In summary, the trend towards private markets and diversified portfolios reflects the changing dynamics of the investment world and is likely to continue. If higher rates are here for longer, the evolving investment landscape requires investors to re-evaluate their portfolio diversification.
With contributions from Eric Wu, Principal, Quantitative Alpha Integration and Strategy, Valerie Xiang, Associate Portfolio Manager, Scott Skirlo Associate Quantitative Researcher, Numeric and Samantha Rosenstock, Deputy CIO of External Alpha, Solutions, Man Group.
1. www.pitchbook.com/news/reports/q3-2023-global-private-market-fundraising-report
2. America has lost half its public companies since the 1990s. Here’s why | CNN Business
3. Source: Bloomberg
4. Source: McKinsey Private markets: A slower era | McKinsey
5. Source: Preqin Q3 2023 Global Private Market Fundraising Report
6. Source: McKinsey 2023 Global Private Markets Review
7. Source: Barclays 2024 Global Hedge Fund Industry Outlook
You are now leaving Man Group’s website
You are leaving Man Group’s website and entering a third-party website that is not controlled, maintained, or monitored by Man Group. Man Group is not responsible for the content or availability of the third-party website. By leaving Man Group’s website, you will be subject to the third-party website’s terms, policies and/or notices, including those related to privacy and security, as applicable.