ARTICLE | 5 MIN | VIEWS FROM THE FLOOR

Static Asset Allocations Aren't Passive Asset Allocations

May 9, 2023

What do you do when correlations change? And an encouraging sign from earnings season.

Correlation Conundrums

When the facts change, John Maynard Keynes famously changed his mind.1 But when correlations change, what do portfolios do?

Using high-frequency data on eight key macro assets, we can see how financial markets changed their focus before and after the emergence of the bank crisis (using 1 March 2023 and 31 March 2023 as the pre- and post- dates). Figure 1 shows the 10-days/5- minutes return correlations across these eight assets. The key benefit of using such high-frequency data, in our view, is the ability to look at short-term variations without losing the breadth of data needed to get a robust correlation estimate.

Among the noteworthy changes between the two panels in Figure 1, we observe that in the space of this single month the equity/bond correlation switched from positive to negative and gold exhibited much less co-movement with other assets.

These structural changes in the correlation matrix had material implications for portfolios. Figure 2 demonstrates this through the two illustrative portfolios that explained most of the variance in these markets. Using Principal Component Analysis (‘PCA’) on these correlations, we uncover the first driver of risk in markets through a long-only multi-asset portfolio (‘PC1’); as would be expected, the portfolio’s loadings were stable throughout.

The second panel, however, represents a more dynamic long/short multi-asset approach (‘PC2’). Here, the same PCA exercise reveals significant change in the portfolio’s component loadings: there is a clear move from being long hard commodities, short bonds and flat equities to being long equities and hard commodities and short bonds and gold. We would characterise this as a repositioning from an inflation- to a growth-oriented regime.

Whatever narrative ultimately prevails, for us the more important conclusion is that high-frequency data can offer insights into what is driving risk in markets – and hence returns in portfolios.

Figure 1. High-Frequency Correlation Matrix

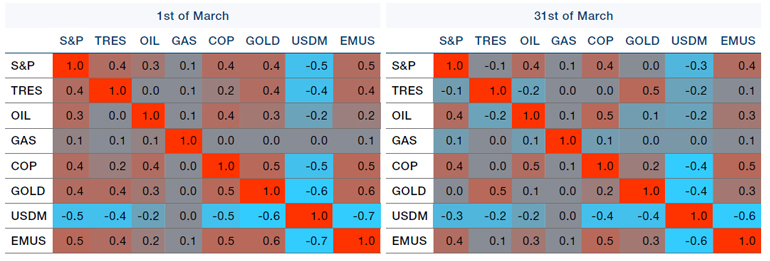
Source: Man AHL; as of 31 March 2023. Assets are S&P 500 Index, US 10-Year Treasuries, oil, natural gas, copper, gold, US dollar versus developed-market currencies, and US dollar versus emerging-market currencies. The organisations and/ or financial instruments mentioned are for reference purposes only. The content of this material should not be construed as a recommendation for their purchase or sale.

Figure 2. Principal Component Analysis Results

Problems loading this infographic? - Please click here

Problems loading this infographic? - Please click here

Source: Man AHL; as of 31 March 2023. The organisations and/or financial instruments mentioned are for reference purposes only. The content of this material should not be construed as a recommendation for their purchase or sale.

Revision Season

As we exit the first-quarter earnings season, our prior biases will probably dictate whether we focus on the high proportion of earnings beats or the starting backdrop of significantly lower consensus estimates.

The former may well simply be a function of the latter, but we think it is worth taking note of the trend in global earnings revisions. Figure 3 shows the 13-week moving average of the ratio of upgrades to downgrades, alongside the performance of the MSCI World Index. The revisions ratio has been trending upwards since January but until the very end of April remained in negative territory, signifying more downgrades of corporate earnings than upgrades – fodder for the bears.

However, as with most things in markets, the delta matters. In the chart, we see clearly that swings from negative and deteriorating to negative and improving have often coincided with major market lows – evident in 2008, 2011, 2016, 2019, and 2020 (as shaded in Figure 3).

In periods when earnings revisions are negative but improving, forward returns have been better in terms of both hit rates and payoffs than for the whole historical sample. Across all six-month periods in the MSCI World Index over this time span, returns were positive 63% of the time with an average gain of +1.8%. In contrast, when the earnings revision ratio was less than zero but rising, the hit rate reached 71% with an average six-month return of +4.5%.

When the upgrade/downgrade ratio rises above zero – so earnings revisions become positive and improving – the record becomes even more bullish: the hit rate improves to 87%, with average six-month returns over 6%.2

Figure 3. Citi Global Earnings Revision Index and MSCI World Index

Problems loading this infographic? - Please click here

Source: Bloomberg; as of 28 April 2023.

1. The apocryphal phrase is commonly credited to Keynes, but the earliest record of him expressing such a sentiment is perhaps even more apt for investors. In a 1924 essay, he wrote: “The inactive investor who takes up an obstinate attitude about his holdings and refuses to change his opinion merely because facts and circumstances have changed is the one who in the long run comes to grievous loss.
2. Source for all calculations: Man GLG and Bloomberg; as of 28 April 2023.

With contribution from: Otto Hamaoui (Director of Portfolio Management, Man AHL) and Ed Cole (Managing Director – Discretionary Investments, Man GLG)

For further clarification on the terms which appear here, please visit our Glossary page.

This information is communicated and/or distributed by the relevant Man entity identified below (collectively the "Company") subject to the following conditions and restriction in their respective jurisdictions.

Opinions expressed are those of the author and may not be shared by all personnel of Man Group plc (‘Man’). These opinions are subject to change without notice, are for information purposes only and do not constitute an offer or invitation to make an investment in any financial instrument or in any product to which the Company and/or its affiliates provides investment advisory or any other financial services. Any organisations, financial instrument or products described in this material are mentioned for reference purposes only which should not be considered a recommendation for their purchase or sale. Neither the Company nor the authors shall be liable to any person for any action taken on the basis of the information provided. Some statements contained in this material concerning goals, strategies, outlook or other non-historical matters may be forward-looking statements and are based on current indicators and expectations. These forward-looking statements speak only as of the date on which they are made, and the Company undertakes no obligation to update or revise any forward-looking statements. These forward-looking statements are subject to risks and uncertainties that may cause actual results to differ materially from those contained in the statements. The Company and/or its affiliates may or may not have a position in any financial instrument mentioned and may or may not be actively trading in any such securities. Unless stated otherwise all information is provided by the Company. Past performance is not indicative of future results.

Unless stated otherwise this information is communicated by the relevant entity listed below.

Australia: To the extent this material is distributed in Australia it is communicated by Man Investments Australia Limited ABN 47 002 747 480 AFSL 240581, which is regulated by the Australian Securities & Investments Commission ('ASIC'). This information has been prepared without taking into account anyone’s objectives, financial situation or needs.

Austria/Germany/Liechtenstein: To the extent this material is distributed in Austria, Germany and/or Liechtenstein it is communicated by Man (Europe) AG, which is authorised and regulated by the Liechtenstein Financial Market Authority (FMA). Man (Europe) AG is registered in the Principality of Liechtenstein no. FL-0002.420.371-2. Man (Europe) AG is an associated participant in the investor compensation scheme, which is operated by the Deposit Guarantee and Investor Compensation Foundation PCC (FL-0002.039.614-1) and corresponds with EU law. Further information is available on the Foundation's website under www.eas-liechtenstein.li.

European Economic Area: Unless indicated otherwise this material is communicated in the European Economic Area by Man Asset Management (Ireland) Limited (‘MAMIL’) which is registered in Ireland under company number 250493 and has its registered office at 70 Sir John Rogerson's Quay, Grand Canal Dock, Dublin 2, Ireland. MAMIL is authorised and regulated by the Central Bank of Ireland under number C22513.

Hong Kong SAR: To the extent this material is distributed in Hong Kong SAR, this material is communicated by Man Investments (Hong Kong) Limited and has not been reviewed by the Securities and Futures Commission in Hong Kong.

Japan: To the extent this material is distributed in Japan it is communicated by Man Group Japan Limited, Financial Instruments Business Operator, Director of Kanto Local Finance Bureau (Financial instruments firms) No. 624 for the purpose of providing information on investment strategies, investment services, etc. provided by Man Group, and is not a disclosure document based on laws and regulations. This material can only be communicated only to professional investors (i.e. specific investors or institutional investors as defined under Financial Instruments Exchange Law) who may have sufficient knowledge and experience of related risks.

Switzerland: To the extent this material is made available in Switzerland the communicating entity is:

  • For Clients (as such term is defined in the Swiss Financial Services Act): Man Investments (CH) AG, Huobstrasse 3, 8808 Pfäffikon SZ, Switzerland. Man Investment (CH) AG is regulated by the Swiss Financial Market Supervisory Authority (‘FINMA’); and
  • For Financial Service Providers (as defined in Art. 3 d. of FINSA, which are not Clients): Man Investments AG, Huobstrasse 3, 8808 Pfäffikon SZ, Switzerland, which is regulated by FINMA.

United Kingdom: Unless indicated otherwise this material is communicated in the United Kingdom by Man Solutions Limited ('MSL') which is a private limited company registered in England and Wales under number 3385362. MSL is authorised and regulated by the UK Financial Conduct Authority (the 'FCA') under number 185637 and has its registered office at Riverbank House, 2 Swan Lane, London, EC4R 3AD, United Kingdom.

United States: To the extent this material is distributed in the United States, it is communicated and distributed by Man Investments, Inc. (‘Man Investments’). Man Investments is registered as a broker-dealer with the SEC and is a member of the Financial Industry Regulatory Authority (‘FINRA’). Man Investments is also a member of the Securities Investor Protection Corporation (‘SIPC’). Man Investments is a wholly owned subsidiary of Man Group plc. The registration and memberships described above in no way imply a certain level of skill or expertise or that the SEC, FINRA or the SIPC have endorsed Man Investments. Man Investments Inc, 1345 Avenue of the Americas, 21st Floor, New York, NY 10105.

This material is proprietary information and may not be reproduced or otherwise disseminated in whole or in part without prior written consent. Any data services and information available from public sources used in the creation of this material are believed to be reliable. However accuracy is not warranted or guaranteed. © Man 2025