China: Reopening, Repricing?
Could China be about to turn the corner? Since the first vaccines appeared in late 2020, the efficacy of domestic vaccines in China has lagged the best of their Western counterparts. With a population under more limited protection, renewed lockdowns and a zero-covid approach have been the levers of choice for policymakers to control the spread of the pandemic.
As such, the share of the Chinese economy affected by lockdowns is as high today as it was six months ago. This has fed through to asset prices, with markets significantly discounting Chinese equities compared to the rest of the world since March 2021 (Figure 1).
However, the tide may be about to turn. China may now have a vaccine solution comparable to that of the West, with CSPC’s vaccine being primed for mass adoption pending approval, and others scheduled to release final stage data within the next two months. In addition, domestic news flow on the virus is now becoming more positive. Requirements for PCR tests to travel by air and rail have been removed in certain cases, and senior physicians such as Dr Guang Zeng (formerly Chief Expert of Epidemiology at the China Centre for Disease Control) have indicated that the country is on a path to easing restrictions. It might now be reasonable to expect a gradual reopening in Q2 2023.
As such, the case for a Chinese equities comeback is getting stronger. There is still a long way to go – but as the economy reopens, we may well see earnings improve throughout 2023.
Figure 1. China Versus RoW Equities
Problems loading this infographic? - Please click here
Source: Bloomberg; as of 8 November 2022.
Concerning Correlations
The aggressive return of stock/bond correlation is hardly a new observation, not least to 60-40 investors who have had to watch both assets plummet in tandem through much of this year. What has caught our interest this week, however, is that this 25-year correlation high is now spilling into other assets with cross-asset class correlations well above their 20-year average (Figures 2 and 3). Of particular note is the correlation of commodity prices to US Treasuries, especially copper, which is at 30-year highs (Figure 4). Intraday correlations between US Treasuries and bunds are also elevated.
The ultimate culprit is inflation, with the Federal Reserve’s rate hikes driving global prices. The resulting US dollar strength means that dollar currency pairs are also becoming markedly more correlated in response, with most Japanese yen pairs becoming less correlated.
The exception remains intra-asset correlations. As we can see from the blue squares, some bonds are less correlated to each other, even as they become more correlated to other assets, possibly reflecting differences in inflation expectations. Likewise, when a specific bond issuer goes through an idiosyncratic shock intra-asset correlations drop, as demonstrated by UK gilts. During the market volatility preceding and following the ‘mini-budget’, the correlation of gilts to US Treasuries and bunds fell markedly, before plateauing following the Conservative party leadership election (Figure 5).
Figure 2. Cross-Asset Correlation Quantiles – 4 November 2022
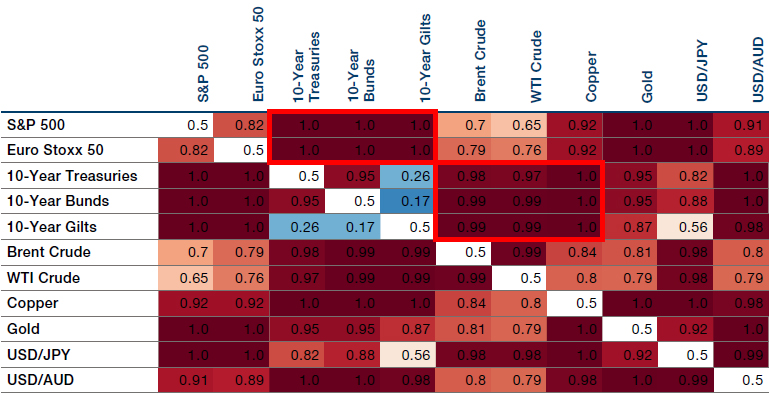
Source: Bloomberg, Man AHL; as of 4 November 2022.
Figure 3. 20-Year Cross Asset Correlation Quantiles
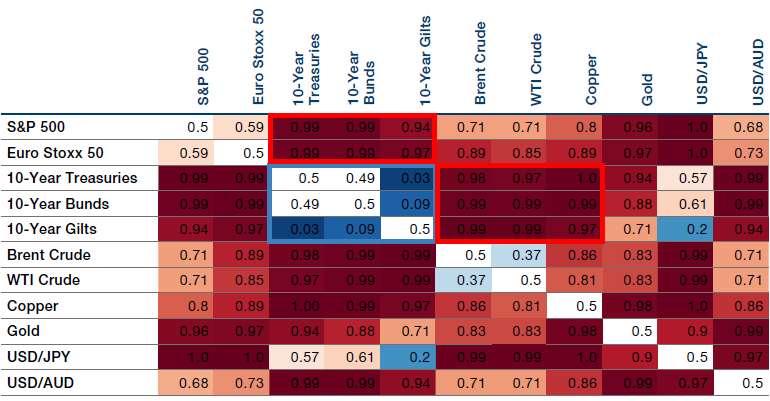
Source: Bloomberg, Man AHL; as of 4 November 2022.
Figure 4. 10-Year Treasuries & Copper Correlation
Problems loading this infographic? - Please click here
Source: Bloomberg, Man AHL; as of 4 November 2022.
Figure 5. Correlations – 10-Year Treasuries, Gilts and Bunds
Problems loading this infographic? - Please click here
Source: Bloomberg, Man AHL; as of 4 November 2022.
With contributions from: Andrew Swan (Man GLG – Portfolio Manager), Stan Whittaker (Man GLG – Analyst), and Fenner Harper (Man AHL – Quant)
You are now leaving Man Group’s website
You are leaving Man Group’s website and entering a third-party website that is not controlled, maintained, or monitored by Man Group. Man Group is not responsible for the content or availability of the third-party website. By leaving Man Group’s website, you will be subject to the third-party website’s terms, policies and/or notices, including those related to privacy and security, as applicable.