Introduction
Campaigning for the first December UK General Election since 1923 is now well underway, with many commentators calling it the most unpredictable in almost as long. So, we begin with a robust caveat: in between our writing and your reading, any number of sleeper issues may have knocked this train off course. Nevertheless, here we bring you our thoughts as they currently stand.
We have a positive view on UK assets (equities and the British pound): we like the risk-reward offered by current valuations and ownership levels, while we see potential for a growth outcome that is better than feared.
In order to consider the political risk to this fundamental investment, we have analysed potential election outcomes. This note shares some of our thinking with respect to the UK election, for those who are interested. It goes without saying that uncertainties are high and we would advise against taking strong investment positions solely based on such events.
What Are the Realistic Outcomes?
We have aggregated the results of the 2017 election with the 2016 Brexit referendum and the 2019 European Parliament election, on a constituency-by-constituency basis. We limit our analysis to those seats which could change hands on a swing of 10 points or less. Within these, we consider the size of the incumbent’s advantage, the strength of the Brexit vote and the extent to which those characteristics carried over into the 2019 poll, as well as any idiosyncratic factors related to that particular seat.
Going through this approach, we currently find four realistic outcomes, as follows:
- Conservative majority;
- Hung parliament: Conservative / Brexit Party coalition;
- Hung parliament: Labour confidence and supply arrangement with the Liberal Democrats (‘Lib Dems’);
- Hung parliament: Labour / Scottish National Party (‘SNP’) coalition.
These outcomes feed from three observations in particular:
- The Conservatives cannot govern without a majority: A dog that bites once bites twice, and a dog that bites twice… Ask Nick Clegg and Nigel Dodds. In any event, the lesson has now surely been learnt;
- A loose arrangement between Labour and Lib Dems is still possible: Jo Swinson has “categorically” ruled out working in coalition with Labour whilst Jeremy Corbyn remains leader, but the possibility of a looser relationship has been left open. His head would be the price;
- A Labour majority is not realistic: Even our most optimistic realistic scenario – in which they successfully defend all 96 seats where there is a credible challenger, and take all 46 of their prime targets – leaves them at 308 and well short of a majority.
What Is Our Base Case for the Parliamentary Arithmetic?
We think Conservatives lose 21 seats, but gain 50, for a majority of 25.1 Our approach assumes the Conservatives are wiped out in Scotland (-12), lose a further seven to the Lib Dems and two to Labour. Conservative gains are concentrated in the traditional Labour heartlands, where Jeremy Corbyn’s perceived indecision on Brexit and ‘Islington values’ will play badly with heavily Leave-voting seats. The biggest regional gains, we believe, will come from the North East and North West (+12), the Midlands (+16) and Yorkshire and The Humber (+10). In short, the narrative of Conservatives sacrificing southern Remain seats to gain northern Leave ones will play out.
Figure 1 shows all the seats each party is defending along with some characteristics of each group. (As a reminder, we define a defensive seat as one where a 10-point swing could see the seat change hands.)
Figure 1. Parties and Their Defensive Seats
| Conservative | Labour | Lib Dem | SNP | ||
|---|---|---|---|---|---|
| 2016 Brexit result | Leave | 83 | 69 | 4 | 0 |
| Remain | 36 | 23 | 8 | 35 | |
| 50/50 Split | 5 | 4 | 0 | 0 | |
| 2017 competitor | Conservative | N/A | 89 | 8 | 11 |
| Labour | 101 | N/A | 0 | 30 | |
| Lib Dem | 14 | 2 | N/A | 2 | |
| SNP | 12 | 5 | 4 | N/A | |
| 2019 Eur Election winner | Labour | 1 | 1 | 0 | 0 |
| Lib Dem | 17 | 9 | 7 | 1 | |
| SNP | 12 | 6 | 2 | 34 | |
| Brexit Party | 94 | 78 | 3 | 0 |
Source: UK Parliament archives, House of Commons archives, Man Solutions; as of 20 November 2019.
In what follows, we elaborate on these characteristics with four observations. First, we don’t think ex-Conservative Remainers (i.e. those who won their seats as Conservatives in 2017, but have since switched to other parties) are going to have much traction. Figure 2 shows three high-profile case studies:
Figure 2. Selected Ex-Conservative Remain Members of Parliament
| Constituency | 2017 MP | Brexit Vote (%) | 2017 Winning Margin (% points) | 2019 Eur Election Winner |
|---|---|---|---|---|
| Beaconsfield | Dominic Grieve | 49 | 44 | Brexit Party |
| Broxtowe | Anna Soubry | 53 | 2 | Brexit Party |
| Totnes | Sarah Wollaston | 54 | 27 | Brexit Party |
Source: UK Parliament archives, House of Commons archives, Man Solutions; as of 20 November 2019.
None are heavy Remain seats. Totnes has been in Conservative hands since 1924, Beaconsfield since its formation as a constituency. Broxtowe is more complex and was tight in June 2017, but this was on record turnout (75%), which benefitted Labour. Whether such enthusiasm is repeatable is dubious, especially in the midst of a British winter. In all three, the Remain vote, thanks to Labour’s bit-of-both stance, will be split. Following the Brexit Party’s decision to stand down candidates in Conservative seats, the Leave vote will be united.
Secondly, the Brexit Party is as much a threat to Labour as to the Conservatives. We ran our analysis on 6 November, but are more confident in our forecast today now that Nigel Farage has announced only Labour seats will be targeted. Don’t underestimate the favour he has done for Boris Johnson. If the 2019 European Elections had been a General Election, the Conservatives would have won a grand total of…no seats. Wiped out, not even metaphorically.
In the remaining seats, we think the Brexit Party take more votes from Labour than the Conservatives. Take Bishop Auckland as an example: a North Eastern seat, which has been Labour since 1935 but voted 61% Leave in 2016, is represented by a Remain MP, and where the Conservatives lost by just one percentage point in 2017. Much of the constituency is traditional coal country, where Margaret Thatcher’s closure of the pits still rankles, and for many voting Conservative is a shibboleth too far. For us, the Brexit Party is the repository, as testified to by its performance in the European elections where it opened up a 20-point gap over Labour.
Thirdly, the Lib Dems may make progress, but it will be hard won. Indeed, they face something of a challenge just to defend what they already have. Of the 12 seats won in 2017, four are in Scotland where the SNP will be very strong (more on this below). A further four voted for Brexit in 2016. Traditionally, the Lib Dems have been Eurosceptic and indeed, was the first major party to call for a referendum in 2007. It seems some of its electorate have not got with the new programme.
Indeed, in terms of the ‘dozens’ of Southern Conservative Remain seats which the Lib Dems allegedly have their sights on, when you actually look at the numbers, it’s clear that these are not open goals. Take Winchester, a textbook example of a fairly solid Conservative seat but which voted 60% to Remain, and is one of the Lib Dem’s stated top targets. In 2017, on a record turnout of 79%, the Conservatives held a 17-point lead (52% versus 35%). Assuming the Lib Dems get all the Green support (through the Remain alliance) and half the Labour voters, that would still leave them 10 points behind, needing to persuade approximately 3,500 Conservatives to change sides. That’s not beyond the realms of possibility – and under our approach, they do indeed capture it – but it’s not easy.
Fourthly, the SNP have Scotland on a plate. We can see this in the European election results. Of the 35 seats it held in 2017 with less than a 20-point lead, only one did not vote SNP in 2019. Of the 22 seats it doesn’t hold but is less than 20 points behind, just three did not. Even a clean sweep north of the wall is not out of the question.
What’s Being Priced?
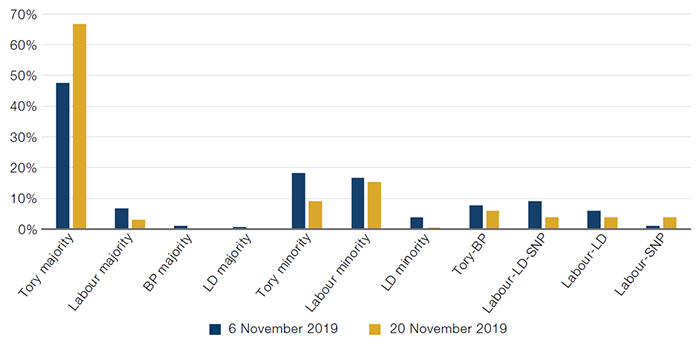
The bookies have radically boosted the implied likelihood of a Conservative majority since the Brexit Party agreed to pull back from Conservative seats. Figure 3 shows the change in implied probabilities for various outcomes between 5 November (when we first ran our analysis) and 20 November. The chance of a Conservative majority has risen from 48% to 67%. From this, we can also infer that another hung parliament was the favoured outcome on 50%, but has since been priced down significantly to 35%.
Figure 3. Bookmakers’ Implied Probabilities of Various General Election Outcomes
Source: Aggregation of the top 10 largest UK bookies via Oddschecker, Man Solutions; as of 20 November 2019.
Bookmakers are now writing bets at the constituency level which provide a useful sense check.
Figure 4 shows the 10 seats where the Conservatives had the slimmest lead in 2017 (‘Tory defence bellwethers’) and the 10 they were closest to (‘Tory attack bellwethers’). This analysis has them winning six for every one they lose. We calculate that if the Conservatives were to achieve half of this ratio across all their marginals, their majority would be around 20.
Figure 4. Tory Bellwethers
| Tory defence bellwethers | Implied chance of victory | 2017 lead (# votes) | Tory attack bellwethers | Implied chance of victory | 2017 lag (# votes) | |
|---|---|---|---|---|---|---|
| Southampton, Itchen | 77% | 48 | Perth and North Perthshire | 33% | 29 | |
| Richmond Park | 22% | 57 | Kensington | 50% | 31 | |
| Stirling | 71% | 199 | Dudley North | 89% | 35 | |
| St Ives | 53% | 409 | Newcastle-Under-Lyme | 75% | 45 | |
| Pudsey | 65% | 445 | Crewe and Nantwich | 75% | 69 | |
| Hastings and Rye | 77% | 495 | Canterbury | 64% | 257 | |
| Chipping Barnet | 64% | 492 | Barrow and Furness | 73% | 305 | |
| Thurrock | 94% | 536 | Keighley | 67% | 330 | |
| Preseli Pembrokeshire |
80% | 436 | Lanark and Hamilton East | 17% | 407 | |
| Calder Valley | 77% | 829 | Ashfield | 42% | 689 |
Source: Aggregation of the top 10 largest UK bookies via Oddschecker, Man Solutions; as of 20 November 2019.
In options world, we don’t see much evidence of a major ruction being priced for the campaign period, although it is obviously harder to make definitive statements.
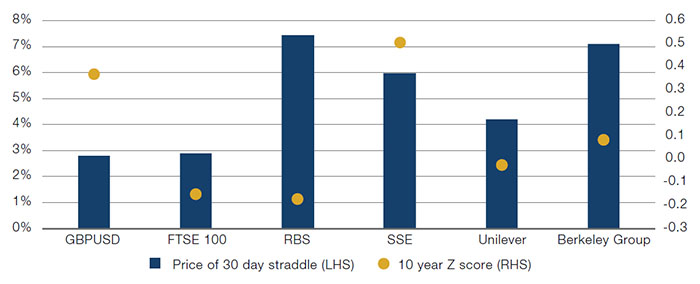
Figure 5 shows 30-day straddle prices as at 20 November (so covering the campaign and results) for GBP/USD and the FTSE 100 Index, as well as for four bellwether election sensitive stocks.
RBS represents banks which would benefit from the rising rate environment the increased certainty of a Conservative majority would entail. Utilities like SSE would be right in the firing line if Labour’s nationalisation plans became a reality. Unilever is one of the UK’s biggest exporters and would be significantly impacted by any major move in the British pound. Housebuilders like Berkeley Group would be set to benefit if a Conservative majority takes measures to alleviate pent-up housing demand, as has been suggested.
As can be seen, none of these assets is implying movements of particular difference to the last 10 years.
Figure 5. 30-Day Straddle Prices for Selected UK Assets
Source: Bloomberg, Man Solutions; as of 20 November 2019.
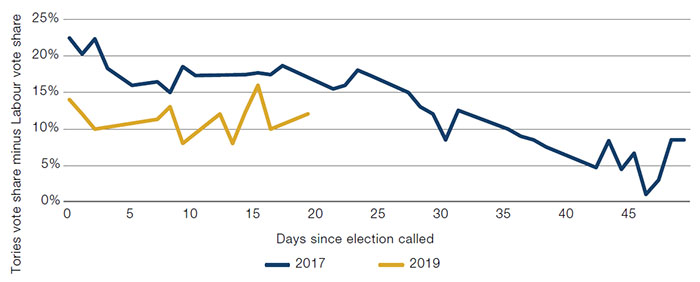
Finally, it’s still early days, but the initial polling evidence suggests the Conservatives’ support relative to Labour is holding up better than it did in 2017. Figure 6 shows the average gap across all polls as it progressed in 2017 (blue line) and how it’s evolving this time around (yellow line). In 2017, the gap began at 23 points and narrowed to nine, although in the election itself, it turned out to be just two. Today, it has so far stayed level between 12-14 points. This being said the big declines in 2017 came later in the campaign in the wake of the Manchester Arena and London Bridge terror attacks. We will be watching this comparator closely, and especially so in the wake of any black swan type events.
Figure 6. Average Polling Gap, 2017 Versus 2019
Source: Aggregation of 10 largest UK pollsters, Man Solutions; as of 20 November 2019.
The Market Implications of a Conservative Majority Base Case
- Sterling up: GBP/USD on a purchasing power parity basis is at 1.43, which is the same as the post-referendum high of April 2018. Trading today at 1.28, the upside in a Conservative majority scenario entailing an orderly exit and a series of market friendly reforms, is surely at least to parity, or +12%. Given sterling’s traditional safe-haven status and a rate trajectory differential more likely than not to be in the UK’s favour, the actual upside could be significantly greater, in our view;
- Gilts down (yields up) in any scenario: In spending terms, the election could be fairly characterised as Labour versus Labour-lite. All sorts of figures are being thrown around and we won’t really know the truth of it until the manifestos are published, but a rough estimate has Labour spending an extra GBP40 billion and Conservatives GBP25 billion per annum. So regardless of who wins, we can be pretty certain debt will rise sharply: in that scenario, we don’t think the UK government will be getting 10-year money at 76 basis points for very long;
- Domestics to outperform exporters: This is a function of strengthening FX. Over the last 12 months, JPMorgan’s UK Exporters Index has outperformed UK Domestics by 500bp (10.9% versus 5.9%). We would expect this gap to close and even reverse;
- Value to outperform Growth and Cyclicals to outperform Defensives: This is driven by rising yields, pent up underperformance and improving economic fundamentals. On our numbers, the UK long/short Value risk premium over the last 12 months has been -460bp. The equivalent number for Growth is -100bp, but rises to +115bp if you exclude forward looking components. Large Cap, Quality and Momentum are +320bp, +520bp and +1,440bp, respectively. Risk is at -890bp. We would expect reversals of similar magnitudes;
- UK to outperform developed markets (‘DM’): Since the 2016 referendum, DM2 have outperformed the UK by 21 percentage points even in own-currency terms (adjusted, it’s closer to 25). On a forward price-to-earnings (‘PE’) basis, the UK is now 15% cheap relative to Europe, the biggest discount since 2000. It is likely the UK is still under-owned. Bank of America Merrill Lynch’s Fund Managers Survey, for example, has a net -18% of asset allocators saying they are overweight UK (calculated as the number of allocators who say they are overweight minus number who say they are underweight). As such, we think there could be a rush for the entrance driving significant outperformance through 2020.
1. Albeit there is some variation here depending on results in Northern Ireland. Given that Sinn Fein do not sit, a strong result for them will result in a higher Conservative majority and vice versa.
2. Represented by MSCI World (excluding EM).
You are now leaving Man Group’s website
You are leaving Man Group’s website and entering a third-party website that is not controlled, maintained, or monitored by Man Group. Man Group is not responsible for the content or availability of the third-party website. By leaving Man Group’s website, you will be subject to the third-party website’s terms, policies and/or notices, including those related to privacy and security, as applicable.