It seems factor investing has gone mainstream. Once relegated to academic and quantitative investing circles, factor portfolios are now widely accessible to individual investors through a wide range of inexpensive, liquid, off-the-shelf products – encompassing value, momentum, quality, size, and multi-factor strategies, among others.
Their growing popularity is a testament to the academic finance community’s decades-long effort to explain the role of factors in stock performance. However, the growth of the space is not without its challenges. As more assets have poured into factor-based investment strategies, factor return profiles have changed. Crowding within these concepts has contributed to factor portfolios realising less alpha and experiencing greater volatility over time, we find.
As the efficacy of traditional factor investing shows signs of waning, investors may consider moving beyond simplistic factors to remain competitive in the market. We favour a multi-faceted quantitative process that incorporates idiosyncratic alpha drivers along with non-traditional datasets and data science techniques. This approach has the potential to deliver robust performance over time, even when traditional factors cannot.
Traditional factor investing… and its pitfalls
Factor investing involves identifying the common characteristics of stocks that tend to drive out- or underperformance over time. Factors such as value, momentum, quality, and size have become ubiquitous in the quantitative investing space and have historically formed the foundation for many investment strategies. Value investing seeks to identify cheap companies, momentum aims to capitalize on directional price trends, quality focuses on stability and profitability, and size plays on the idea that smaller companies have tended to historically outperform larger ones over time.
Traditional combinations of these factors in quant portfolios were fairly effective from the late 1980s through to the early 2000s. However, over the past couple of decades, as these concepts have become more popular and therefore more crowded, that efficacy has decreased, generating lower returns with higher volatility. This phenomenon has held true regardless of geography (figure 1).
Figure 1: Hypothetical rolling 10-year factor returns of a generic quant model* by selected regions from 1996 through to Q2 2026
Source: Man Group, S&P Alpha Factor Library and Numeric calculations. Hypothetical past performance is not indicative of future results. *We define a ‘generic quant model’ to be 40% Value + 30% Momentum + 10% Capital Efficiency + 10% Earnings Quality + 10% Small Size. The weights are somewhat arbitrary and reflect a more value-trend oriented quant process. Universe of 3,000 stocks in North America, 1,500 stocks in Europe/Asia, and 750 in Emerging Markets based on market cap. Stocks are weighted proportional to sqrt (market cap) in each respective region, and the model excludes China A shares.
Problems loading this infographic? - Please click here
Traditional factor investing approaches can also carry significant macroeconomic regime dependence, as explored in more detail in our previous research. Even within multi-factor portfolios, which seek all-weather diversification properties, returns can break down in macroeconomic crisis periods, when company fundamentals may take a back seat to market-wide sentiment – exactly when investors need the diversification benefits the most.
Beyond traditional factor portfolios
If the traditional factor concepts underpinning quantitative approaches have become largely commoditized and struggle to outperform, have quantitative strategies run their course? How could investors position their portfolios instead?
We believe the key going forward is to evolve the approach, developing a multi-faceted quantitative process that extends beyond the realm of traditional factor investing. Through a quantitative research framework and constant innovation, we strive to uncover differentiated sources of alpha that seek to deliver robust returns into the future. An important part of how we unearth these alpha drivers is exploring non-traditional datasets and data science techniques.
Alternative data is information found in external sources, beyond conventional financial statement data or official company reports. It can span many different disciplines and provide distinct insights that standard company filings cannot. While these datasets are often unstructured and require skilled data scientists to glean useful information, we find they tend to surface timelier and differentiated insights compared to traditional data sources.
One example: social media mentions of a company. These seemingly minor mentions can accumulate and form the basis of an investment signal. The aggregate view could help assess a company’s brand value and provide a near real-time view of customer sentiment on a continuous basis, without having to wait for a quarterly reporting cycle. This assessment of a company’s value can be materially diversifying and return-enhancing relative to traditional valuation methods, in our view.
Alternative data sources can also provide granular perspectives into niche areas of the market. That’s why skilled use of varied alternative datasets tend to yield deeper insights into specific segments of the market than what is possible via traditional datasets alone. We have invested significant time and effort into alternative data research, exploring over 350 datasets across a variety of categories since the start of 2020, all with the goal of incorporating novel, differentiated alpha drivers within our equity investment process (figure 2).
Figure 2: 350+ selected alternative dataset categories explored at Man as share of total projects
Source: Man Numeric. Data as at Sept 30, 2026. Represents alternative data research projects over the period from 1 Jan 2020 – 30 Sept 2026.
Problems loading this infographic? - Please click here
AI and machine learning: forging new factor relationships
In addition to non-traditional datasets, novel data science techniques can help generate new, differentiated sources of alpha. Advances in machine learning and other forms of artificial intelligence (AI) have given quantitative managers the ability to approach factor investing in new ways, including examining the nature of relationships between factor concepts, rather than simply assigning static exposures to those factors.
Modern machine learning techniques have the ability to identify non-linear factor relationships with return profiles that are less correlated with classic factor returns. Utilization short interest, which captures the level of short positioning in a stock, is an intuitive example of a factor with a non-linear payoff pattern. Short positions are generally viewed as high-conviction trades given that shorting is costly and can be hard to maintain in the face of market volatility. In that light, greater short positioning is generally viewed as a negative indicator for stock price performance, and this can be measured via a higher utilization short interest factor score. However, the relationship between the short interest factor score and its predictive efficacy for stock returns is not linear.
The chart below (Figure 3) plots the utilization short interest factor score, which measures the level of shorting in a stock, along with the corresponding level of return prediction from that factor for a broad universe of stocks within the MSCI World index. The pattern and trend show that when there is a low level of short positioning in a stock (indicated by a strongly negative factor score), the short interest factor’s level of return prediction tends not to vary much. This means that incremental changes in short interest tends to produce little change in the factor’s predictive power. In other words, the short interest factor cannot typically differentiate between stocks when there is a low level of shorting data to work with.
However, beyond a certain threshold of short interest, short positioning may quickly become an increasingly powerful negative signal for stock price performance, as high conviction traders tend to increasingly express their negative positioning in a stock. These dynamics explain why the data in the chart below do not follow a simple linear pattern. Non-linear relationships such as these, as well as non-linear payoffs from combinations between multiple factors, can be used to develop a quantitative model to inform portfolio positioning.
Figure 3: Factor scores and corresponding levels of return prediction across all stocks in the MSCI World index
Source: Man Group, S&P Alpha Factor Library. Data as at 31 Aug 2026. Represents factor scores and corresponding levels of return prediction across all stocks in the developed market equity universe.
Problems loading this infographic? - Please click here
Machine learning techniques, along with other forms of AI, can also be used to try to time factor exposures, as well as in-house investment signals, using a wide range of time horizons and data points to inform factor and signal positioning. These techniques can inform factor positioning in a materially different way than traditional approaches, seeking a superior risk and return profile.
A look ahead in quant investing
Traditional factor investing may be at an inflection point, and investors may not be able to rely on it as much as in the past. We believe that declining alpha payoffs, worsening volatility profiles, and sensitivity to macroeconomic regimes require investors to think beyond simplistic approaches. Diversifying a quantitative investment process with distinct alpha sources generated via alternative datasets and advanced data science techniques may be one way to help build more robust investment strategies over time.
An explosion of alternative datasets and rapid advancements in AI-based data science techniques has provided a plethora of opportunities for quantitative research (figure 4). Compared to even just a decade ago, the amount of data sets available and types of ways to analyze them has grown substantially, and in our view, looks poised to continue.
Figure 4: Sample of selected alternative dataset growth areas (top panel) and evolution of major AI-based data science techniques (bottom panel)
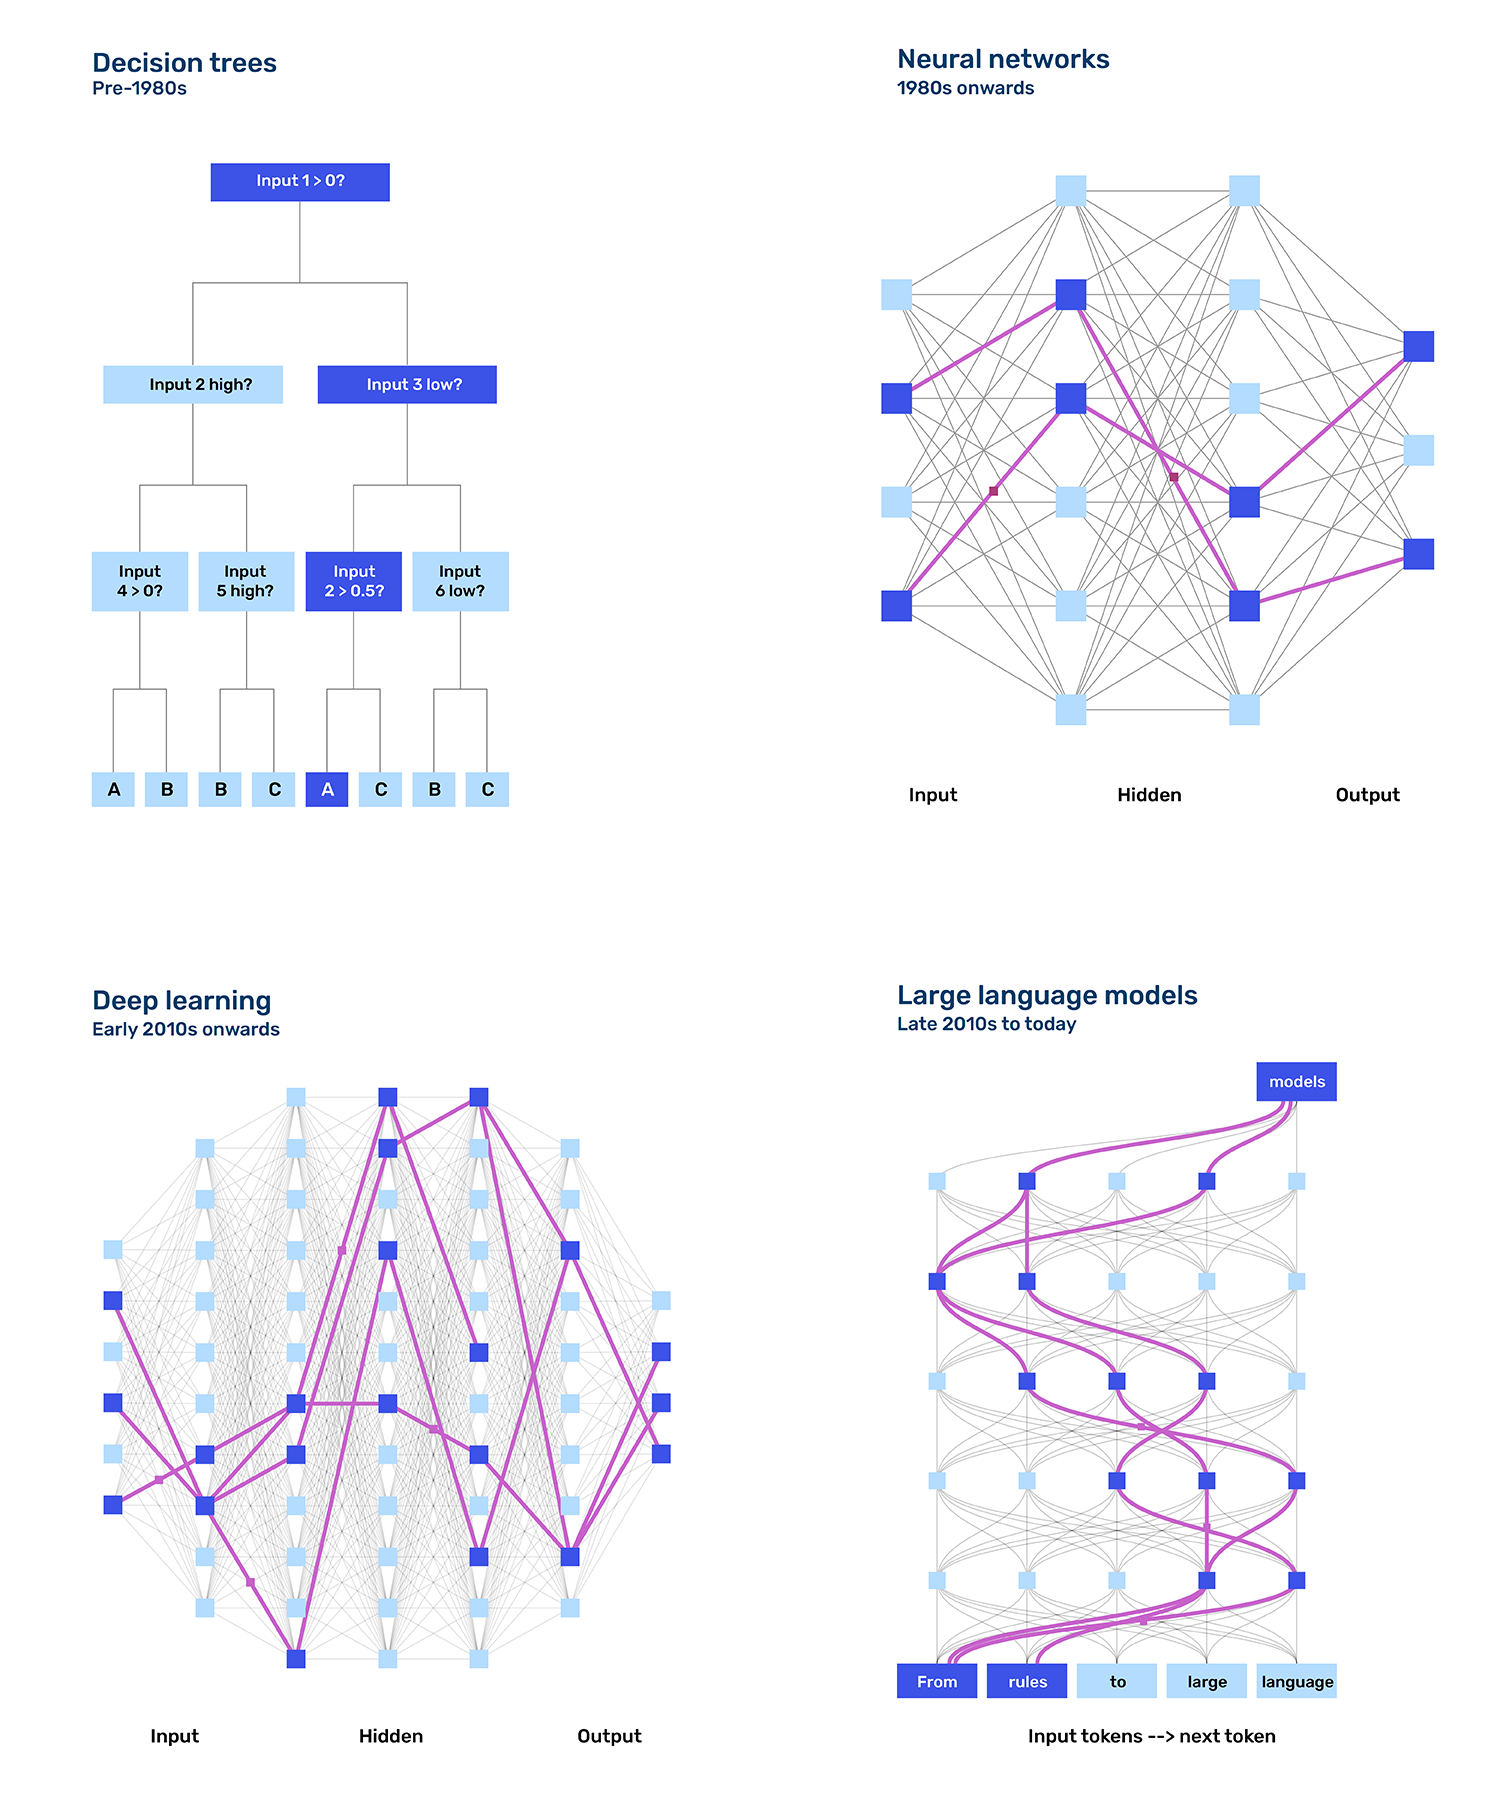
Source: Neudata, Man Group. Based on datasets available through data scouting firm Neudata by year of publication date, as at September 2026. ESG represents environmental, social, and governance. B2C represents business to consumer.
Problems loading this infographic? - Please click here
New datasets have spanned both developed and emerging markets, and novel data science techniques have similarly shown efficacy across regions, adding differentiated, granular insights even to more regionally focused investment strategies. Along with the exponential growth in computing capabilities to power this research, we feel these developments look promising for quantitative approaches seeking to extend beyond traditional factor investing.
Harnessing these potential opportunities will take more than just access to new data and techniques, in our view. The advantage is most likely to accrue in managers with deep experience across quantitative strategies and market cycles, given the need for sophisticated trading execution platforms and strong risk controls. In the end, we think the true differentiation relative to traditional factor-based approaches may come down to the firms with the most research-centric cultures committed to technological advancement and innovation.
You are now leaving Man Group’s website
You are leaving Man Group’s website and entering a third-party website that is not controlled, maintained, or monitored by Man Group. Man Group is not responsible for the content or availability of the third-party website. By leaving Man Group’s website, you will be subject to the third-party website’s terms, policies and/or notices, including those related to privacy and security, as applicable.