Introduction
Prime Minister Boris Johnson won big in the UK elections. His absolute majority of 80 becomes a working majority of 90 once the seven Sinn Fein members (who don’t sit), the speaker and two deputy speakers (who are neutral) are excluded. That’s the biggest advantage for any party since Labour in 2001 (working majority of 174) and for the Conservatives since 1987 (106).
After the election was called, we noted four drivers that would deliver a Conservative majority. All four of these played out.
The Four Drivers
Firstly, those who supported Remain were not successful. We see this in the case of the ‘Conservative exiles’, the former Members of Parliament (‘MPs’) who stood for other parties due to their opposition to Brexit (namely Anna Soubry, Dr Sarah Wollaston, David Gauke, Dominic Grieve, Sam Gymiah and Dr Phillip Lee). Respectively, these lost by 10, 24, 24, 27, 17 and 12 percentage points. In the aftermath, one thing seems clear: the UK will leave the EU.
Secondly, and as an extension of our first point, the Liberal Democrats underperformed the expectations they set at the start of the campaign. On the eve of the election, the party held 20 seats, up from the 12 it won in 2017 due to its absorption of defectors from other parties. That number has fallen to 11.
Thirdly, the Brexit Party took more votes off Labour than the Conservatives. We can’t be certain of this, but we present some evidence in Figure 1. Here, we show the 35 Tory ‘shock wins’ i.e. the seats they hadn’t held for decades and in many cases, ever. For each, we show the swing away from Labour inverted (red bars), overlaid with the swing to the Conservatives (dark blue) and to the Brexit Party (light blue). In most cases, the swing away from Labour is roughly equivalent to the sum of the swing to the Conservatives and the Brexit Party. This suggests the contest was less blue-on-blue, and more blue versus red.
Figure 1. The Shock Conservative Wins
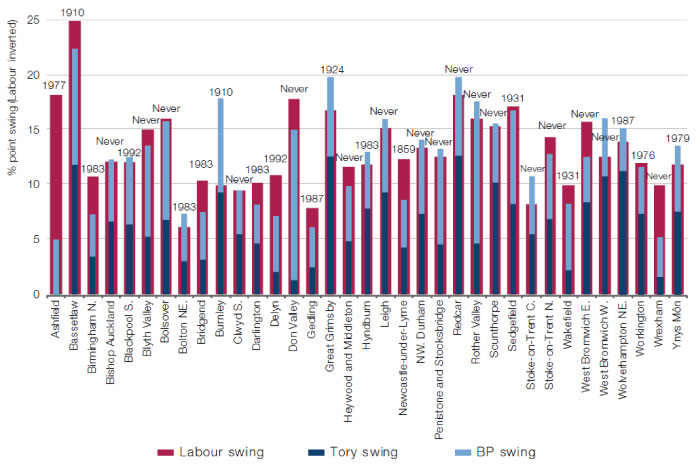
Source: Man Solutions, BBC; as of 13 December 2019. Note: Data labels demarcate the last time the seat was blue.
Finally, the Scottish National Party cleaned up in Scotland. With 48 of the 59 Scottish seats, a constitutional battle beckons, with First Minister Nicola Sturgeon convinced that this gives a mandate for a second independence referendum, and the Conservatives equally assertive that the SNP can sling their hook.
So, what does the UK election results mean for UK assets?
Sterling Up
In July, when Johnson first became Prime Minister, the Conservative and Labour parties were equal in the polls and cable was at 1.24. Between then and the eve of the election, the polls moved 10 points in the Tories’ favour, and the pound was up 5.8% to 1.32. As the exit poll was released, there was a jump of 3.6% which, at time of writing1, has been almost completely retraced as Johnson has used his first days back in office to continue banging the hard Brexit drum. Our expectation is for this pattern to continue: volatility as trade arguments rage, but with a pronounced upward trajectory.
Figure 2. GBP/USD – Purchasing Power Parity and Actual
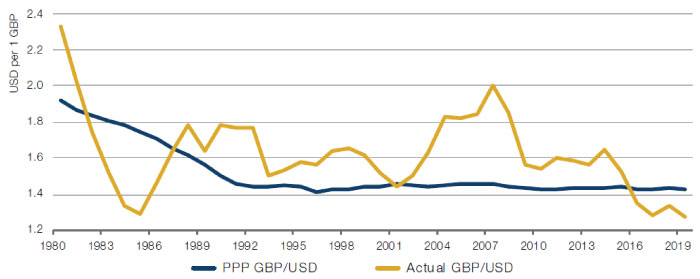
Source: IMF, Goldman Sachs, Bloomberg; as of 18 December 2019
Figure 3. Mutual Fund Outflows From UK Since May 2016
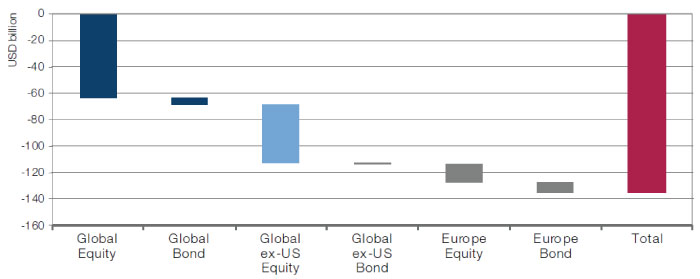
Source: IMF, Goldman Sachs, Bloomberg; as of December 2019.
What is fair value for the British pound? On the IMF numbers, purchasing power parity (‘PPP’) is the level at which the pound would have to be to buy an identical basket of goods in the UK and the US) has cable at 1.43, or 9% further upside from where it trades today. Historically, sterling has traded at or above PPP, as shown in Figure 2, with the recent weakness unsurprisingly being associated with uncertainty in the aftermath of the 2016 Brexit referendum.
Looking at swap pricing over the next 12 months, the market is implying a 77% chance of a Federal Reserve rate cut (implying a policy rate of 1.4%), a 26% chance of an European Central Bank cut (to -0.5%) and a 41% chance of a Bank of Japan cut (to -0.1%). On the same basis, the Bank of England has a 79% chance of cutting, to 0.5%. We believe the UK has the most chance of surprising to the upside as Brexit uncertainties are removed and growth improves. Of course, there’s going to be headline-induced volatility over the next 12 months, but we believe resolution is on the way.
UK Yields Up (Bonds to Underperform)
Jeremy Corbyn recently said that even though Labour had lost the election, they had “won the argument”. This left some critics scratching their heads as to what losing the argument would have looked like, given that the election was Labour’s worst seats tally since 1935. But, in fact, Corbyn has a point: austerity is over.
The Conservative manifesto effectively promised an additional GBP100 billion of capital spending over the next five years, around 5% of GDP. Only GBP22 billion of this has so far been allocated to specific projects. Our expectation is that the rest of this money will be spent in short order as Johnson seeks to consolidate the many post-industrial ‘left behind’ seats he won. In this scenario, we don’t believe the government will have 10-year money at 78 basis points for too long.
We believe investment will pick up significantly following the result, which boosts activity and is positive for equities. From the soothing of the Eurozone crisis in 2012 to the Brexit referendum in 2016, real investment in the UK economy grew at a 4.4% CAGR. Since then, this has fallen to 0.5%. As shown in Figure 4, if investment had continued to rise at this pre-referendum trend, there would have been more than GBP11 billion of extra real spending, or 2.2 points of GDP. The bulk of the decline has come from the business sector, whose CAGR has fallen from 4.6% to 0.1% over the equivalent periods. Households are also down, however, from 5.4% to 2.2%, and government from 2.2% to 1.6%. Regarding the latter, the new administration’s looser fiscal bent, already discussed, should prove a fillip.
Figure 4. UK Capital Investment
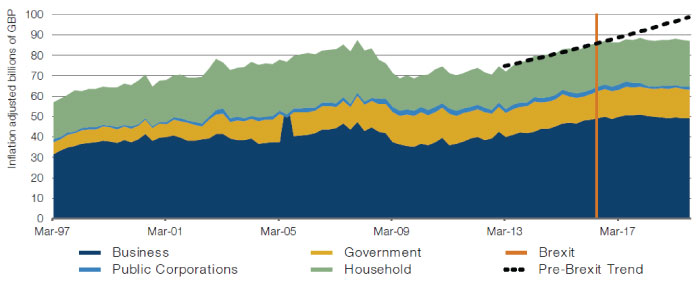
Source: CNS, Lazarus Economics, Morgan Stanley, Man Solutions; as of 18 December 2019.
UK Equities to Outperform Developed Markets
Since the 2016 Brexit referendum, MSCI World has outperformed MSCI UK by 15 percentage points in own currency basis (53% versus 38%), and by 29 percentage points on common currency (53% versus 24%).2 On Goldman Sachs’s estimates, mutual funds around the world have pulled GBP135 billion from UK equities and bonds, as detailed in Figure 3. We believe this could reverse and are already starting to see some evidence of it. The Bank of America Merrill Lynch fund manager survey, for example, showed asset allocators moving from a 21% underweight to a 13% underweight between November and December.
Figure 5. UK Valuation
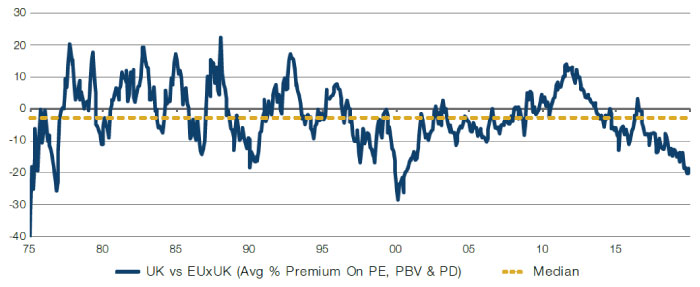
Source: CNS, Lazarus Economics, Morgan Stanley, Man Solutions; as of 18 December 2019.
A business-friendly political formulation is coming at a point when UK valuations are historically low. As shown in Figure 5, the discount for UK versus Europe ex-UK is the lowest in 20 years, and prior to that, since the 1970s. The 2020 dividend yield for MSCI UK is 4.8%, versus 3.3% for MSCI Europe ex UK.3 Similarly, the 2020 price-to-earnings (‘PE’) ratio is 12.5 times for the UK, against 15.1 times for the rest of Europe.
The Economic Cycle
Within UK equities, we are bullish on Value, Small Caps and Risk. We are bearish on Growth, Momentum and Quality. In addition, we prefer cyclicals over defensives and domestics over exporters.
We have an economic cycle model for the UK inspired by the work of BAML. The model combines a number of cyclically sensitive indicators as exponentially weighted z-scores: below 1 and falling is ‘Recession’, below 1 and rising is ‘Recovery’, and vice versa for ‘Boom’ and ‘Slowdown’. The model is shown in Figure 6.
As at the end of November, the model had already ticked up. We require two consecutive months to confirm we have entered a new regime. We believe the election results will catalyse trends already underway, and the UK will move into ‘recovery’ within the next few months. The UK manufacturing PMI seems to have troughed around 47 and we expect reduction in uncertainty will proceed to push this well into expansionary territory. This will start being reflected in other forward-looking estimates; the 3-month moving average of the UK EPS revisions ratio calculated as:
(# upgrades - # downgrades) / total # of estimateshas fallen for four consecutive months, from 0.7 to 0.4, and should turn up from here, in our view.
Figure 6. The Economic Cycle Model
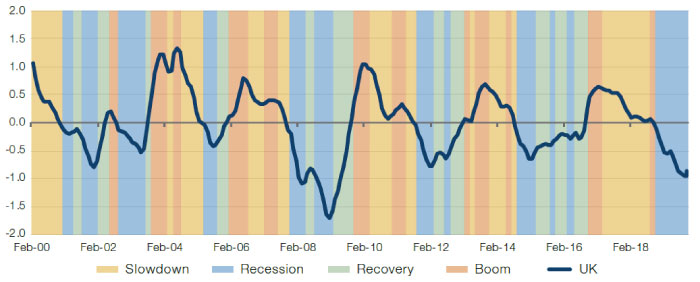
Source: Man Solutions, Bloomberg; as of 18 December 2019.
Figure 7 shows how different UK sectors and styles have performed in our four regimes. In ‘recession’, on average, Value underperforms Growth by an annualised 400 basis points, whilst Small Cap underperforms Large Cap by 200bp and Mid Cap by 500bp. Sectors which have Defensive and Quality characteristics, such as Healthcare (+6%) and Consumer Staples (+6%) outperform those of a more Cyclical and Risky flavour, such as Materials (-11%) and Financials (-11%). The situation largely reverses in ‘recovery’. Value outperforms Growth by 500bp, whilst Small Cap outperforms Large Cap by 1,300bp and Mid Cap by 200bp. Materials and Financials are the big winners (+30% and +21%), whilst Defensive names lag (Consumer Staples, Communication Services, Healthcare and Utilities are at +16%, -13%, +10% and +10%, respectively).
Our indicator has been in ‘recession’ phase since November 2018. Over the last 12 months, UK Value, Small Cap and Risk have been weak (Q1-Q5 spread of -70, -140 and -680bp, respectively), whilst Growth, Momentum and Quality have been strong (+140, +1,140 and +580bp on the same basis). As discussed, our view is that the election result will lead to stronger activity, rising discount rates and consolidation of risk-on sentiment, and we believe Styles and Sectors reverse accordingly.
Figure 7. CAGRs for Sectors and Styles
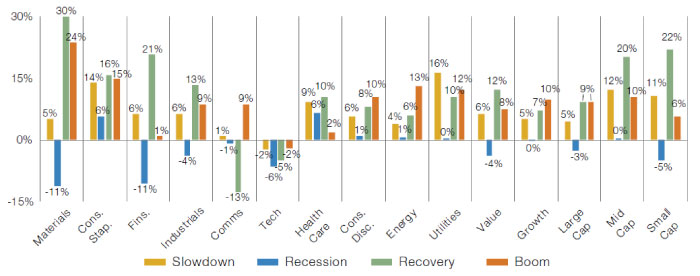
Source: Man Solutions, MSCI, Bloomberg; as of 18 December 2019.
1. As of 18 December 2019.
2. As of 18 December 2019.
3. As of 18 December 2019.
You are now leaving Man Group’s website
You are leaving Man Group’s website and entering a third-party website that is not controlled, maintained, or monitored by Man Group. Man Group is not responsible for the content or availability of the third-party website. By leaving Man Group’s website, you will be subject to the third-party website’s terms, policies and/or notices, including those related to privacy and security, as applicable.