This is an excerpt from a chapter in ‘Portfolio Construction Management: Innovation and Challenges in the Digital Age’, published in January 2021.
Introduction
But, the proof of the pudding, of course, is in the tasting. Do the components of the Z-shifts make a difference?
Over the past few years, we have written about how it is possible to build portfolios using tried-and-tested risk management techniques that have similar risk characteristics to traditional portfolios, but with improved returns. Termed the ‘Z-shift’ because of the figure drawn in risk-return space, the technique makes use of diversification, capital efficiency and risk management overlays.
In the Z-shift, the route from the traditional 60/40 portfolio to, in our view, a more optimal portfolio, is as follows.
- Step 1: Diversification
Classic finance theory tells us that diversification improves expected risk-return. The first step of the Z-shift is moving from the 60/40 portfolio to the more diversified portfolio (Figure 1) with the highest Sharpe ratio among unlevered efficient frontier investments, as measured by the slope of the line connecting it to the T-bill investment. Diversifying lowers risk, but can also reduce expected returns, so… - Step 2: Capital Efficiency
…through the use of cash efficient instruments such as futures, a diversified portfolio can be scaled up to achieve the desired return, taking us outside the efficient frontier and scaling up risk in the process. But asset managers we can still do better… - Step 3: Risk Management
Asset Managers can dynamically risk manage the portfolio using techniques common among active managers like hedge funds, but often under-utilised by others. Such techniques monitor the risk landscape in real-time, and rely upon an advanced execution platform to adapt positions in a timely manner should risks change.
But, the proof of the pudding, of course, is in the tasting. Do the components of the Z-shifts make a difference?
Implementing the Z-Shift
Haydon (2018) provides a detailed account of how layering the various Z-shifts, including the various risk mitigating controls, changes the risk and return of 60/40 portfolios. In Figure 1, we do something similar and illustrate how the three steps of the Z-shift framework change the cumulative return profile, using a portfolio of around 50 highly liquid predominantly futures markets spanning equities, credit, and inflation asset classes. We factor in transactions costs of around 30 basis points per year which, through the modelling of Man Group’s execution research team, is consistent with a fund size of around USD3 billion.
Figure 1. Cumulative Simulated Returns, From 60/40 to a Full Implementation of the Z-Shift
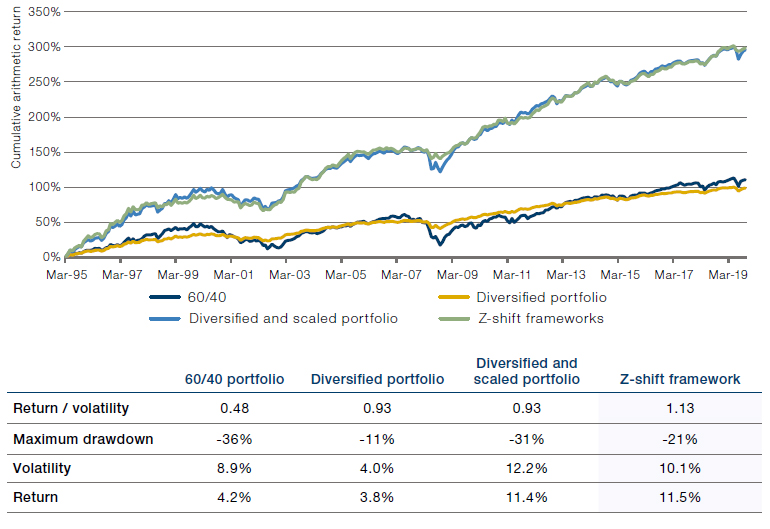
Source: Man Group; Between 31 March 1995 and 30 June 2020.
Simulated past performance is not indicative of future results.
Performance data should be considered hypothetical, is not based on actual trading, has inherent limitations, and should not be relied upon. Please see the end of this paper for additional important information on hypothetical results. This approach has inherent limitations, including that results may not reflect the impact material economic and market factors might have had on the investment manager’s decision-making and/ or the application of any trading models had the strategy been managed throughout the period over which the simulated performance is illustrated. No fees have been applied.
The starting point is the 60/40 portfolio (dark blue line). The performance of this portfolio has been impressive since March 2009, when the recovery from the Global Financial Crisis started. However, the return over the preceding 10 years was about zero, as the bursting of the tech bubble and the Global Financial Crisis wreaked havoc on the 60/40 portfolio, whose risk is dominated by the equity component.
Note how significantly improved the drawdown periods were, with the worst drawdown still better by 10 percentage points.
The Diversified portfolio (yellow line) experiences a much smoother ride, but falls short of 60/40 in terms of the full-sample performance. That is, the lower allocation to equities, higher allocation to bonds and an allocation to credit and inflation-sensitive assets greatly reduces risk while also somewhat reducing the total return.
The Diversified & Scaled portfolio (light blue line) has a much higher performance, but with drawdowns similar to that of 60/40.
The final Diversified & Scaled & Risk-Managed portfolio (green line) performed similarly in the long-term to the Diversified and Scaled portfolio, but note how significantly improved the drawdown periods were, with the worst drawdown still better by 10 percentage points. Visually, it is also clear that drawdown is materially reduced during both periods where the VIX index topped 80, during the Credit Crisis in 2008 and the Covid-19 sell-off of 2020.
Conclusion
With the application of hedge fund and risk management techniques, we show that it is possible to improve both the returns and risk properties of traditional 60/40 portfolios. By diversifying, scaling and then risk-managing the portfolio, it is possible to enhance outcomes throughout some of the more seismic selloffs of recent years.
You are now leaving Man Group’s website
You are leaving Man Group’s website and entering a third-party website that is not controlled, maintained, or monitored by Man Group. Man Group is not responsible for the content or availability of the third-party website. By leaving Man Group’s website, you will be subject to the third-party website’s terms, policies and/or notices, including those related to privacy and security, as applicable.