Correlation Conundrums
When the facts change, John Maynard Keynes famously changed his mind.1 But when correlations change, what do portfolios do?
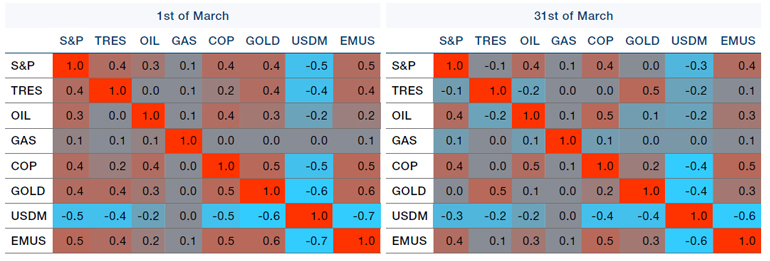
Using high-frequency data on eight key macro assets, we can see how financial markets changed their focus before and after the emergence of the bank crisis (using 1 March 2023 and 31 March 2023 as the pre- and post- dates). Figure 1 shows the 10-days/5- minutes return correlations across these eight assets. The key benefit of using such high-frequency data, in our view, is the ability to look at short-term variations without losing the breadth of data needed to get a robust correlation estimate.
Among the noteworthy changes between the two panels in Figure 1, we observe that in the space of this single month the equity/bond correlation switched from positive to negative and gold exhibited much less co-movement with other assets.
These structural changes in the correlation matrix had material implications for portfolios. Figure 2 demonstrates this through the two illustrative portfolios that explained most of the variance in these markets. Using Principal Component Analysis (‘PCA’) on these correlations, we uncover the first driver of risk in markets through a long-only multi-asset portfolio (‘PC1’); as would be expected, the portfolio’s loadings were stable throughout.
The second panel, however, represents a more dynamic long/short multi-asset approach (‘PC2’). Here, the same PCA exercise reveals significant change in the portfolio’s component loadings: there is a clear move from being long hard commodities, short bonds and flat equities to being long equities and hard commodities and short bonds and gold. We would characterise this as a repositioning from an inflation- to a growth-oriented regime.
Whatever narrative ultimately prevails, for us the more important conclusion is that high-frequency data can offer insights into what is driving risk in markets – and hence returns in portfolios.
Figure 1. High-Frequency Correlation Matrix

Source: Man AHL; as of 31 March 2023. Assets are S&P 500 Index, US 10-Year Treasuries, oil, natural gas, copper, gold, US dollar versus developed-market currencies, and US dollar versus emerging-market currencies. The organisations and/ or financial instruments mentioned are for reference purposes only. The content of this material should not be construed as a recommendation for their purchase or sale.
Figure 2. Principal Component Analysis Results
Problems loading this infographic? - Please click here
Problems loading this infographic? - Please click here
Source: Man AHL; as of 31 March 2023. The organisations and/or financial instruments mentioned are for reference purposes only. The content of this material should not be construed as a recommendation for their purchase or sale.
Revision Season
As we exit the first-quarter earnings season, our prior biases will probably dictate whether we focus on the high proportion of earnings beats or the starting backdrop of significantly lower consensus estimates.
The former may well simply be a function of the latter, but we think it is worth taking note of the trend in global earnings revisions. Figure 3 shows the 13-week moving average of the ratio of upgrades to downgrades, alongside the performance of the MSCI World Index. The revisions ratio has been trending upwards since January but until the very end of April remained in negative territory, signifying more downgrades of corporate earnings than upgrades – fodder for the bears.
However, as with most things in markets, the delta matters. In the chart, we see clearly that swings from negative and deteriorating to negative and improving have often coincided with major market lows – evident in 2008, 2011, 2016, 2019, and 2020 (as shaded in Figure 3).
In periods when earnings revisions are negative but improving, forward returns have been better in terms of both hit rates and payoffs than for the whole historical sample. Across all six-month periods in the MSCI World Index over this time span, returns were positive 63% of the time with an average gain of +1.8%. In contrast, when the earnings revision ratio was less than zero but rising, the hit rate reached 71% with an average six-month return of +4.5%.
When the upgrade/downgrade ratio rises above zero – so earnings revisions become positive and improving – the record becomes even more bullish: the hit rate improves to 87%, with average six-month returns over 6%.2
Figure 3. Citi Global Earnings Revision Index and MSCI World Index
Problems loading this infographic? - Please click here
Source: Bloomberg; as of 28 April 2023.
1. The apocryphal phrase is commonly credited to Keynes, but the earliest record of him expressing such a sentiment is perhaps even more apt for investors. In a 1924 essay, he wrote: “The inactive investor who takes up an obstinate attitude about his holdings and refuses to change his opinion merely because facts and circumstances have changed is the one who in the long run comes to grievous loss.
2. Source for all calculations: Man GLG and Bloomberg; as of 28 April 2023.
With contribution from: Otto Hamaoui (Director of Portfolio Management, Man AHL) and Ed Cole (Managing Director – Discretionary Investments, Man GLG)
You are now leaving Man Group’s website
You are leaving Man Group’s website and entering a third-party website that is not controlled, maintained, or monitored by Man Group. Man Group is not responsible for the content or availability of the third-party website. By leaving Man Group’s website, you will be subject to the third-party website’s terms, policies and/or notices, including those related to privacy and security, as applicable.