A Real Problem for Equities
Inflation has been stickier and the US economy stronger than some expected. Together, these developments have fed the narrative that interest rates have not yet peaked in this cycle. This emerging consensus has sent real rates materially higher over the past month (Figure 1). Indeed, the jump of around 75 basis points in two months places this move in the 98th percentile of real-rate changes over equivalent periods since 1997.1
The spike in real rates matters because such accelerations have rarely been positive for risk assets. Figure 2 shows how stocks, high-yield bonds and commodities have typically been much weaker when real rates surge.
One interpretation is simply that leaps in real rates represent a transition to a much more adverse liquidity environment. By this view, US real rates were pushed deep into negative territory by the Federal Reserve through the initial Covid period to incentivise the deployment of cash. The reverse now seems to be the intent.
Figure 1. US Real Rates
Problems loading this infographic? - Please click here
Source: Bloomberg; as of 1 June 2023. Chart portrays the GTII05 Govt index of the spread between the US five-year nominal and breakeven yields.
Figure 2. Performance of Assets When Real Rates Increase (1997-2023)
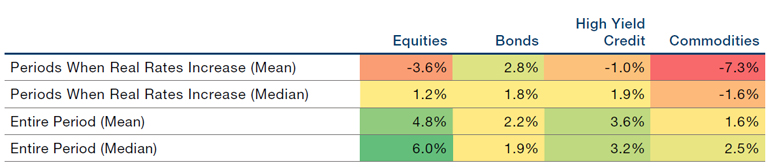
Source: Man GLG and Bloomberg; as of 30 May 2023.
Chips Versus Gravity
As its share price rocketed after its latest earnings report , NVIDIA’s price-to-sales ratio crossed 30.2 In Figure 3, we highlight 11 significant examples of S&P 500 companies that have hit that mark since 2015. Few were able to live up to such high expectations. Some are admittedly a little anomalous: the trio of cruise companies reached the threshold only when their sales collapsed in the Covid years.
But of those that reached 30 primarily because of multiple expansion instead, there are a number of pharma names. This has typically been because they released a new drug marketed as the only solution to a condition, and so garnered frothy forward expectations from analysts.
NVIDIA may be in a comparable position: its chips, protected by patents, dominate the burgeoning AI market. The company’s sales may therefore grow into its valuation. It is, however, by far the largest business to attract this multiple since Cisco during the dotcom bubble. It is also unusual to see a traditionally cyclical name, like a semiconductor manufacturer, climb to a dizzying sales ratio.
Our past research on apparently absurd valuations suggested most extremely expensive stocks do succumb to share-price gravity, even if on a fundamental basis they do fulfil their promise. But there are outliers – we will see whether NVIDIA can be such an exception.
Figure 3. S&P 500 Stocks That Have Reached a 30x Price-to-Sales Ratio since 2015
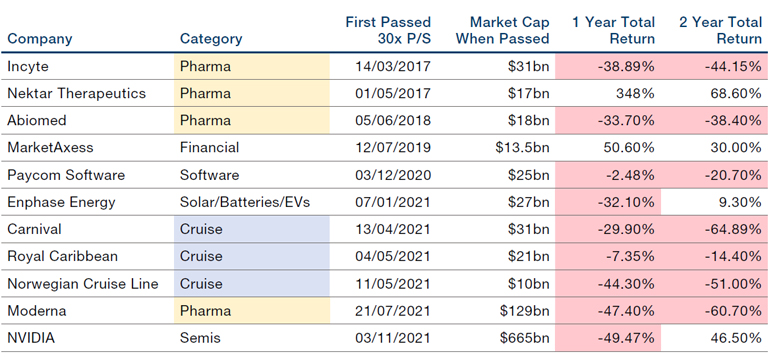
Source: Man Numeric, Worldscope and Bloomberg; as of 26 May 2023. Securities identified via Worldscope based on trailing 12-month sales, excluding outliers with a price-to-sales ratio over 500. Only first instance of passing 30x is shown. Two-year returns for Moderna and NVIDIA are from the first point of crossing 30x to 26 May 2023. The organisations and/ or financial instruments mentioned are for reference purposes only. The content of this material should not be construed as a recommendation for their purchase or sale.
Oil’s Other Supply Cut
Serious signs are emerging of weakening oil demand, in our view. In the quarter to 1 June 2023, West Texas Intermediate (WTI) first-line futures are down by nearly 11%.3
OPEC’s production cut in early April looks increasingly like it was a reaction to deteriorating demand, perhaps in the context of lower-than-expected consumption from Asia. OPEC has since cut production again over the past weekend. Saudi Arabia will shoulder the bulk of this burden via a voluntary output reduction of one million barrels a day; the kingdom arguably needs a higher oil price to continue financing a host of major ‘Vision 2030’ projects, such as the Neom smart-city development that has an estimated budget of $500 billion.
At the same time, the US rig count has been rolling over since December and is now almost 12% below its peak (Figure 4). At face value, it looks as though either US producers have little confidence in the price staying high, or that cash flows of around $70 per barrel of WTI are insufficient to incentivise new production.
If the latter explanation turns out to be the case, we believe it will ultimately be supportive of crude prices on a multi-year basis, as it emphasises the lack of marginal new supply in a world where consumption over the rest of this decade at least looks set to continue to grow.
Figure 4. Baker Hughes United States Crude Oil Rotary Rig Count
Problems loading this infographic? - Please click here
Source: Bloomberg; as of 5 June 2023.
1. Source: Man GLG; as of 1 June 2023.
2. Source: Bloomberg; as of 31 May 2023. Note that NVIDIA first passed a 30x price-to-sales ratio in November 2021, as shown in Figure 3.
3. Source: Bloomberg; as of 5 June 2023.
With contribution from Ed Cole (Managing Director – Discretionary Investments, Man GLG) and Eric Wu (Principal – Quantitative Alpha Integration and Strategy, Man Numeric).
You are now leaving Man Group’s website
You are leaving Man Group’s website and entering a third-party website that is not controlled, maintained, or monitored by Man Group. Man Group is not responsible for the content or availability of the third-party website. By leaving Man Group’s website, you will be subject to the third-party website’s terms, policies and/or notices, including those related to privacy and security, as applicable.