US Housing: Location, Location…Inflation Mitigation?
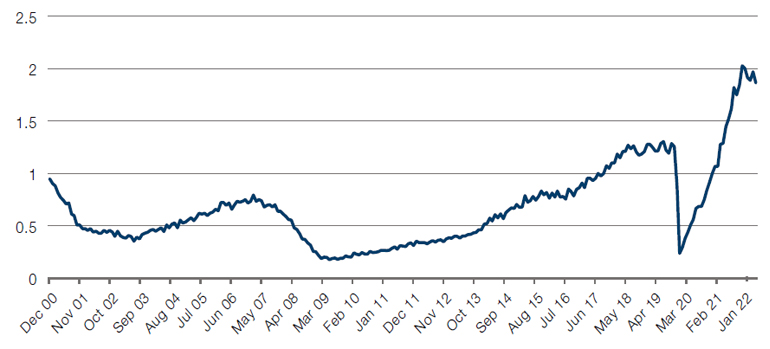
The hawkish tone set by recent Federal Reserve speakers has understandably arrested recent falls in US mortgage rates, with a 50bps jump since August taking the 30-year average fixed rate mortgage back above 5.5% (Figure 1). Yet while present rates have more than doubled from the lows of 2021, they are still cheaper than their 50-year average of around 8%.
Buying a house in the US was already at historical extremes of affordability, with the latest housing-to-cost-income ratio at 39.9%, according to John Burns Real Estate Consulting, compared with a range of 25-30% between 2009 and 2020. Higher mortgage rates are making it even harder for many families to buy, requiring them to continue renting. In turn, this greater demand for rental properties is likely to push rents higher. We expect single-family rents (which generally adjust automatically each year) to increase by more than 5% this year, compared with a 30-year average of around 3%, with tenants supported by a resilient labour market.
As we have previously argued, such dynamics make single-family rentals an attractive inflation hedge – a thesis which continues to be supported by experience (Figure 2). That said, while real estate in aggregate may be robust – sustained by a favourable balance of low housing supply and ongoing demand as millennials seek to become homeowners – there is no such thing as a truly national market. Individual cities and regions consistently show divergent price action, driven by market-specific factors. A number of areas have enjoyed appreciation far in excess of the national median of 55% since 2017 (Figure 3); some with strong local economies may hold onto these gains, but others that drew remote workers post-pandemic may be overheating as they see more construction in response.
Figure 1. US 30-Year Fixed Rate Mortgage Average
Problems loading this infographic? - Please click here
Source: Bloomberg; as of 8 September 2022.
Figure 2. Annual Rent Versus Inflation
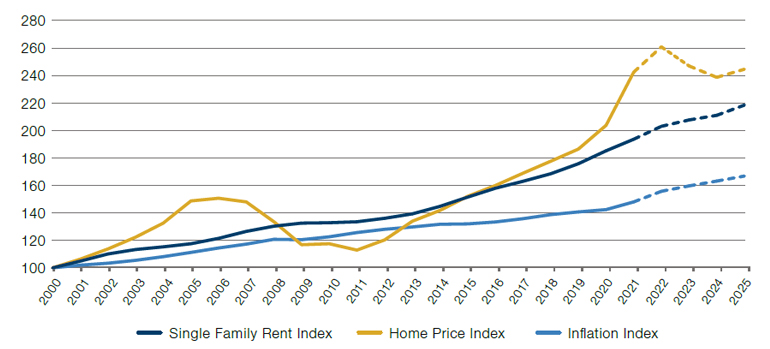
Source: John Burns Real Estate Consulting, LLC (Data), US Bureau of Economic Analysis, National Association of Realtors; as of May 2022.
Figure 3. Metro Areas With High Home Price Appreciation Since January 2017
Problems loading this infographic? - Please click here
Source: Man GPM; as of September 2022.
Demand Softens…
Demand is a tricky thing. Earlier this year there was too much of it, overwhelming supply chains and leading to gridlock in ports across the world.
Now the tables have turned. Aside from energy, demand for commodities is softening rapidly. The CRB RIND index, which measures demand for non-speculative commodities, has fallen by 14% from its high of 689 in March (Figure 4).
The precarious situation may deteriorate further: global manufacturing purchasing managers’ indices (PMIs) are sliding below 50, indicating economic contraction. As purchasing managers begin to prepare for a downturn, demand for raw commodities – traditionally a barometer for global commerce – may continue to soften as consequence.
Figure 4. CRB RIND Index
Problems loading this infographic? - Please click here
Source: Bloomberg; as of 9 September 2022.
Figure 5. World Manufacturing PMIs
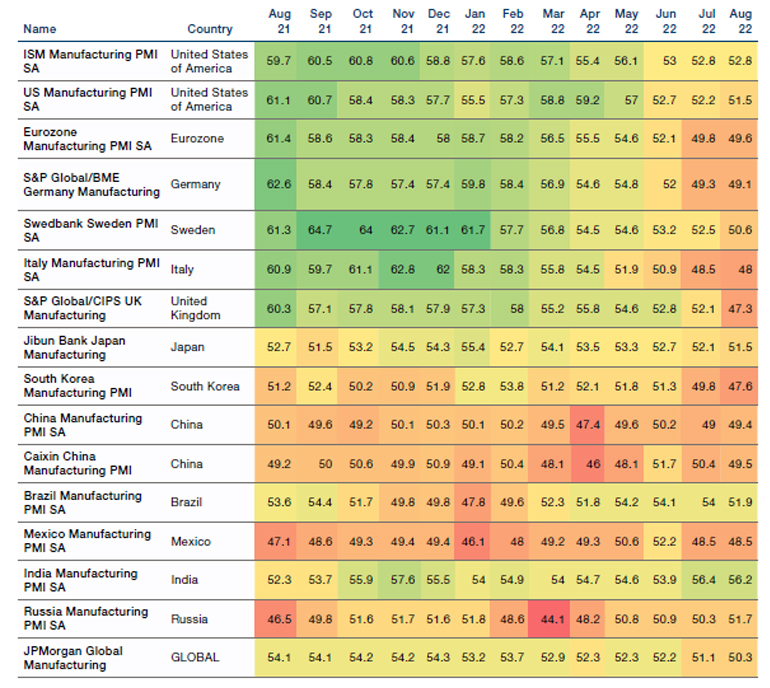
Source: Bloomberg, Man GLG; as of 6 September 2022.
…But Not Enough For the Fed
But the early stages of softening demand are no longer enough for the Fed to step in. Cycle timing metrics such as employment remain healthy, with two job openings for every unemployed American and hiring intentions softening only slightly (Figure 6-7).
Instead, those on Fed Watch will have noted comments by Neel Kashkari, President of the Federal Reserve Bank of Minneapolis, which focused on five- and ten-year real rates as the driver of economic activity.
August saw the US 5-year real rate rise by almost 90bps, one of the most extreme moves in a sample of over 25-years (Figure 8). Since Jerome Powell told us at Jackson Hole that the Fed needs to see a prolonged period of sub-trend growth, positive real rates will be welcomed by the Fed as a restraint on new business activity. This marks a material shift versus the post-pandemic period, where real rates were firmly negative. At that time, our read was that by pushing real rates so deeply negative, the Fed was begging economic actors to allocate capital to higher risk assets and projects or else be punished with negative real return. For markets, such an environment of positive and rapidly rising real rates has tended to pose a challenge: history shows that equities underperform bonds, commodities tend to fare poorly, and within equities more defensive styles have worked best. In some sense, it feels like we have returned to the ‘good news is bad news’ scenario that we experienced in 2019: unless we see high real rates and slowing data, risk asset investors can no longer rely on the Fed to bail them out when the going gets tough.
Figure 6. US Vacancy to Unemployment Ratio
Source: Bloomberg; as of 6 September 2022.
Figure 7. Regional Fed Surveys – Hiring Intentions
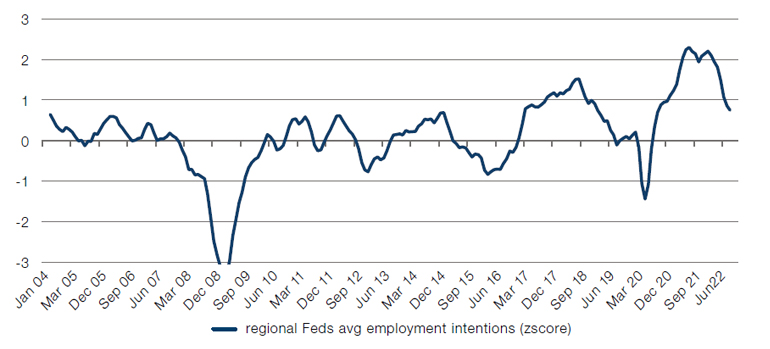
Source: Federal Reserve, Bloomberg; as of 6 September 2022.
Figure 8. US 5-Year Real Rate
Problems loading this infographic? - Please click here
Source: Bloomberg; as of 9 September 2022.
With contributions from: Eric Atlas (Man GPM – Head of US Residential Debt) and Ed Cole (Man GLG – MD of Discretionary Investments)
You are now leaving Man Group’s website
You are leaving Man Group’s website and entering a third-party website that is not controlled, maintained, or monitored by Man Group. Man Group is not responsible for the content or availability of the third-party website. By leaving Man Group’s website, you will be subject to the third-party website’s terms, policies and/or notices, including those related to privacy and security, as applicable.