Does a Bear Market Always Mean a Recession?
The S&P 500 Index fell into bear market territory on Friday 20 May – defined as a 20% from its recent high – the first time since March 2020, when markets sold off over fears around the Covid-19 pandemic.
But does a bear market always lead to a recession?
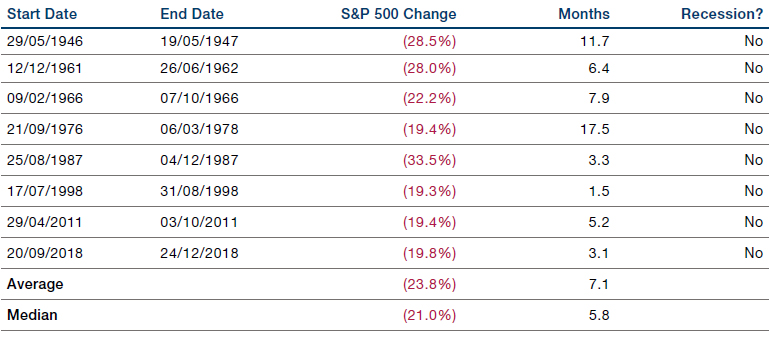
Since World War II, the S&P 500 has experienced 18 bear markets or near bear markets.1 However, of those, eight did not lead to a recession (Figure 1). The reason? The Federal Reserve rode in on a white horse and stimulated the economy through loose monetary policy.
However, there is one stark difference between those eight bear markets and the current one: the Fed did not have to grapple with inflation. Indeed, the Fed is currently in the middle of a tightening cycle to stem soaring inflation: it raised its benchmark interest rates by 0.5 percentage points to a target of between 0.75% and 1% in May, the largest since 2000. And more rate hikes are expected.
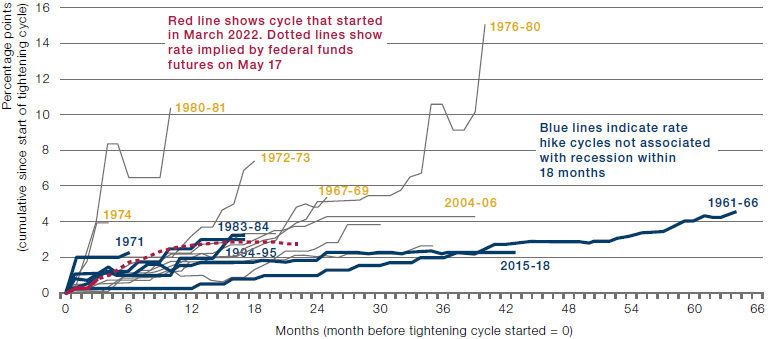
Since 1950, there have been 15 US tightening cycles. Of those, all but five ended in recession (Figure 2)…
Figure 1. Bear Markets Which Did Not Lead to a Recession

Source: LPL Research, FactSet; as of 13 May 2022.
Figure 2. Since 1950, 10 of 15 Tightening Cycles Ended in Recession

Source: Bloomberg; as of 23 May 2022.
How Bad is Bad…
Equities have sold off across the globe this year, with most major indices down this year as of 19 May 2022: the S&P 500 Index by 17.7%, the NASDAQ 100 by 28.0%, the Russell 2000 by 20.9%, the FTSE 100 by 1.8%, the FTSE 250 by 17.2%, the Euro STOXX 50 by 16.2% and the STOXX Europe 600 by 12.9%.
But what matters to investors is not just how far an index falls. The breadth of damage is also key – how many of the stocks listed are down?
Figure 3 shows the return of the above indices by constituent. Each dot represents an individual stock, with the dot’s size showing the company’s relative market cap: the larger the dot, the bigger the company. If the dot is below zero on the y-axis, it has had a negative return year-to-date.
As we can see, not only are returns negative at an index level, but a majority of individual names are also in negative territory. For all of these indices, around 80% of stocks have had a negative return in 2022. Investors have therefore had few places to hide.
What is interesting is the sector bias: mega-cap companies have tended towards negative returns, especially in tech-heavy indices such as the NASDAQ and the S&P 500. However, this isn’t a size bias. Indices skewed towards smaller companies, such as the Russell 2000 and FTSE 250, have more stocks with negative returns than their larger-cap counterparts.
In short, this year’s selloff has been very bad. Not only are stock markets down, so many names are down that investors have had little shelter.
Figure 3. Individual Stock Returns in 2022 – Selected Indices
Problems loading this infographic? - Please click here
Note: Stocks sized relative to market capitalisation.
Source: Bloomberg, Man GLG. As of 17 May 2022.
…For Hedge Funds?
Unsurprisingly, given how many names are down, hedge funds have not been immune. The Goldman Sachs Hedge Funds VIP index – a measure of the positions that appear most frequently among the top 10 long equity holdings within the portfolios of fundamentally driven hedge fund managers, based on filings with the SEC2 – underperformed the S&P 500 Index this month by almost three percentage points (Figure 4).
Hedge fund short positions have also suffered. However, in the past month there has been a clear disparity between the VIP Short index, which has gained 0.1% month-todate, and the Hedge Funds VIP Index, which is down 5.5%.
In our view, some of the discrepancy can be explained by de-grossing: with increased volatility, hedge funds have cut their long exposures, leading to higher drawdowns in long books. Morgan Stanley data indicate that weighted gross leverage amongst hedge funds has fallen to 180% (Figure 5). This is well below the trend since the pandemic, which has been between 185%-195%, and is closer to 2015 levels.
Figure 4. Goldman Sachs Hedge Fund VIPs Index, Goldman VIP Short Index and S&P 500 Index
Problems loading this infographic? - Please click here
Source: Bloomberg; as of 13 May 2022.
Figure 5. Hedge Fund Weighted Gross Leverage
Problems loading this infographic? - Please click here
Source: Morgan Stanley; as of 17 May 2022.
With contribution from: Russell Korgaonkar (Man AHL, CIO), Gilles Gharios (Man GLG, Head of Investment Risk) and Jonathan Daffron (Man FRM, Deputy Head of Investment Risk)
1. https://edition.cnn.com/2022/05/20/investing/premarket-stocks-trading/index.html#:~:text=They’re%20a%20sign%20of,by%20LPL%20Financial’s%20Ryan%20Detrick.
2. www.gsam.com/content/dam/gsam/pdfs/us/en/ETF/Goldman-Sachs-Hedge-Fund-VIP-Index-Methodology.pdf?sa=n&rd=n
You are now leaving Man Group’s website
You are leaving Man Group’s website and entering a third-party website that is not controlled, maintained, or monitored by Man Group. Man Group is not responsible for the content or availability of the third-party website. By leaving Man Group’s website, you will be subject to the third-party website’s terms, policies and/or notices, including those related to privacy and security, as applicable.