The Currency of Alpha: Dispersion in EMD
Much has been made of the US dollar’s recent retreat from its September heights. But what of the world’s other currencies? It is becoming increasingly hard to view them simply as a homogenous bloc on the opposite side of the pair, as emerging-market currencies are making abundantly clear.
Not so long ago, currency valuations – as measured by the deviation of their real effective exchange rate (REER) from their five-year average – were extremely clustered (Figure 1). This was the era of quantitative easing (QE), when easy liquidity suppressed volatility and correlations converged towards one. We are now in a very different environment, characterised by quantitative tightening and significant divergences in countries’ post-pandemic economic outlooks. REERs have accordingly gone from a band of +/- 10% to a much wider range.
The same pattern is evident among hard-currency emerging-market sovereign bonds (Figure 2). The line shows the trimmed mean spread of countries within the index (with the 10% widest and 10% tightest outliers trimmed so as not to distort the picture). The bars indicate the full spread spectrum as measured by +/- one standard deviation. The pre-Covid QE period is again characterised by both relatively tight spreads and little dispersion. From early 2020 on, we see the notable elevation in both spreads and dispersion – to an even greater extent than during the depths of the global financial crisis.
Taking all this together, we believe that EMD markets are no longer governed solely by directional long or short beta, as was the case when volatility was constrained; instead, investors can now seek to generate alpha by picking the winners and avoiding the losers.
Figure 1. Distribution of REER Misalignment Pre-Covid Versus Today
Problems loading this infographic? - Please click here
Source: Bloomberg and Man GLG; as of 7 December 2022. Pre-Covid defined as 31 October 2018.
Figure 2. 20% Trimmed Mean Spread over Treasuries for J.P. Morgan Emerging Markets Bond Index Global Core Countries, and +/- 1 STD
Problems loading this infographic? - Please click here
Source: Bloomberg and Man GLG; as of 31 October 2022.
Let’s Not Be Crude About Energy
‘Energy prices are down, but energy stocks are up.’ The sentence seems paradoxical; after all, companies that extract and sell a commodity should have stock prices which resemble the rise and fall in the price of their product.
Yet since 30 June 2022, this hasn’t been the case: WTI crude is down 31% while the S&P Energy Sector is up 18% (Figure 3).
If we subscribe to the idea that markets are not completely irrational, there has to be an explanation. Investors may be taking a longer-term view: while energy prices are down, the sector is trading on 8x earnings, and is firmly within the Value factor. Likewise, its cheapness may understate the possibility of earnings growth. As major energy importer China re-opens for business, and there is higher seasonal demand in Europe, investors seem to expect that energy prices will rise and sustain energy stocks once more. Or it’s a prime opportunity for some profit taking in energy stocks.
Figure 3. WTI Crude Versus S&P 500 Energy Index
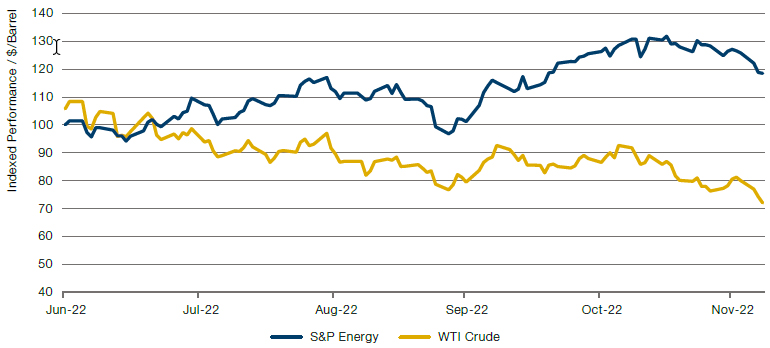
Source: Bloomberg; as of 7 December 2022.
ESG Stocks Recharged in H2 2022
After a tough start to 2022, ESG themes have had a mixed performance in the second half of the year (Figure 4).
A significant tailwind was the US Inflation Reduction Act. Announced in July and signed into law on 16 August, the Act guaranteed funding for USD369 billion of climate-related investments over the next 10 years. ESG theme baskets outperformed the S&P 500 index as this bill made progress through Congress, and for some time afterwards, although most of the outperformance had been given back by early October.
Since then, ESG themes have recharged, particularly water and climate solutions, which have outperformed the S&P 500 by 10-15% since early October, despite lower crude prices which tend to undermine the profitability of renewables. With a general energy squeeze, the need to invest in renewables has never been higher, which is now being reflected in stock pricing even as energy prices fall. On the other hand, rising commodity prices and the underperformance of Growth stocks have heavily weighed on the electric-vehicles basket, which may need lower inflation to see outperformance.
Figure 4. S&P 500 Index Versus ESG Baskets
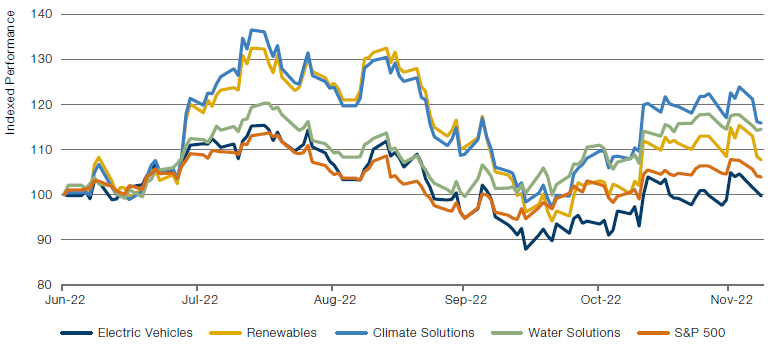
Source: Bloomberg; as of 7 December 2022.
With contributions from: Phil Yuhn (Man GLG – Asset Manager of Emerging Market Debt Strategies) and Rob Furdak (Man Group – CIO for Responsible Investment).
You are now leaving Man Group’s website
You are leaving Man Group’s website and entering a third-party website that is not controlled, maintained, or monitored by Man Group. Man Group is not responsible for the content or availability of the third-party website. By leaving Man Group’s website, you will be subject to the third-party website’s terms, policies and/or notices, including those related to privacy and security, as applicable.