Quote of the Week:
"Could it be peak oil? Possibly. Possibly. I would not write that off."
A Car Crash in Slow Motion: Introducing the Weekly Economic Indicator
The Federal Reserve has created a new economic indicator, named the Weekly Economic Indicator (‘WEI’). What distinguishes the WEI from other indicators is that it gives a broad snapshot of economic activity much more frequently than other metrics, allowing for a more real-time analysis of what is happening in the US economy. It measures the year-on-year changes of 10 factors, equally weighted and with no seasonal adjustment: same store sales; weekly unemployment claims; continuing claims; employment tax withholdings; railroad traffic; staffing index; steel production; weekly sales of gasoline, diesel, jet fuel; and US electricity load.
The Fed’s dataset goes back to 2008, allowing us to make direct comparisons between the economic impact of the coronacrisis and the Global Financial Crisis (Figure 1). During 2008, the WEI fell -4% – which perfectly overlapped with realised-chained GDP (Figure 2) – and was negative for 61 weeks. For every quarter that the index remains at -12%, we would see full-year US GDP contract by 3%. If, on the other hand, we were to experience a perfect V-shaped recovery with current levels as the nadir (which, by the way, would not be our central assumption), the Corona episode would have shaved 2% points off the full-year GDP outturn.
What does this mean for asset prices? Using the WEI as a baseline and assuming a V-shaped recovery, our analysis suggests an overall permanent loss to US GDP of 6.1% by the end of 2021 (Figure 3). As a consequence, this would imply a 27% cut to consensus earnings for 2020. In contrast, the GFC saw a peak-to-trough fall of 77% for quarterly EPS.
Figure 1. The US Weekly Economic Indicator
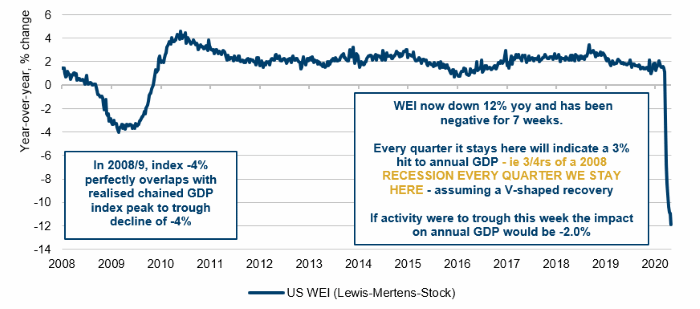
Source: Federal Reserve Bank of New York, Bloomberg; as of 9 May 2020.
Figure 2. US Nominal and Real GDP, Earnings - GFC
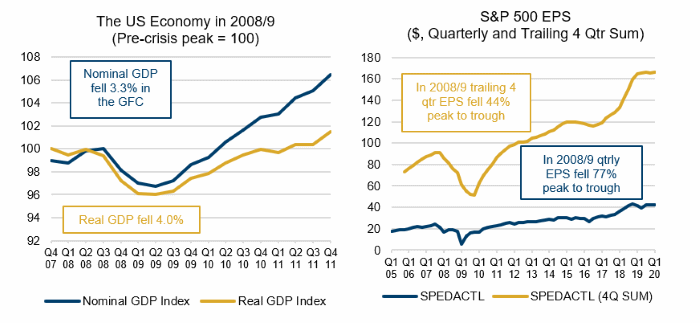
Source: Bloomberg; as of 2011.
Figure 3. Forecasted US Nominal and Real GDP, Earnings – Post-Coronacrisis
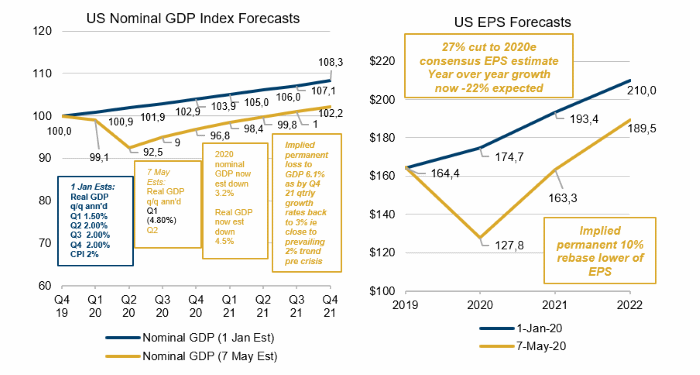
Bloomberg, Man Solutions; as of 12 May 2020.
China’s Credit Impulse: Lend!
China’s credit impulse – a measure of the change in new credit issued as a percentage of GDP – is rising at the fastest rate since 2012/2013 (Figure 4). After a policy of limiting credit expansion throughout 2018-19, as shadow banking was severely restricted, there has been a reversal from the People’s Bank of China. In its latest monetary policy statement, references to “avoid excess liquidity” were deleted – confirming that policymakers intend to support the economy via the credit channel again.
This has been borne out in the data. Total social financing (‘TSF’) has expanded by CNY14.2 trillion in the first four months of the year, compared with CNY25.6 trillion during the entirety of 2019 (Figure 5). The proportion of financing from outside the banking sector is also growing rapidly, comprising only 11.3% of TSF in January 2020 but reaching 29.2% in April. By contrast, non-bank lending was just 5.8% of TSF in 2019.
China’s response to the coronavirus therefore seems to be relatively clear, for the moment at least. Whilst there has been some debate as to whether the PBOC should opt for novel monetary policy, and purchase bonds directly from the Chinese government, for the moment, innovation has been put on hold; the solution, in the short term, is to lend.
Figure 4. Chinese Credit Impulse
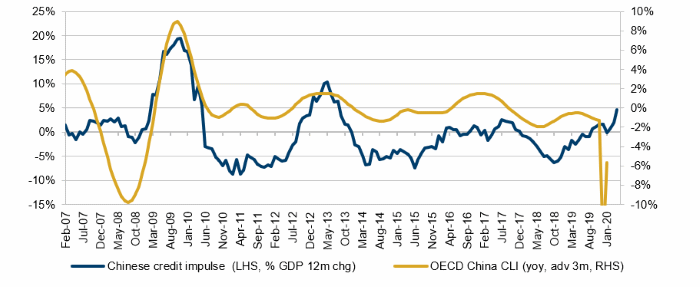
Source: Bloomberg, OECD; as of 30 April 2020.
Figure 5. Chinese Lending Activity
| RMB bn | YTD-annualised | Apr-20 | Mar-20 | Feb-20 | Jan-20 | 2019 |
|---|---|---|---|---|---|---|
| Entrusted loans | -464.7 | -57.9 | -58.8 | -35.6 | -2.6 - | 940 |
| Trust loans | -31.8 | 2.3 | -2.1 | -54 | 43.2 - | 347 |
| Banker’s acceptance | 251.1 | 57.7 | 281.8 | -396.1 | 140.3 - | 476 |
| Corporate bonds | 8,001.6 | 901.5 | 981.9 | 389.4 | 394.4 | 3,242 |
| TSF | 42,501 | 3,090 | 5,149 | 858 | 5,070 | 25,575 |
| NBF % TSF | 18.2% | 29.2% | 23.4% | -11.2% | 11.3% | 5.8% |
Source: Man GLG; as of 30 April 2020.
Scraps of Hope: Raw Materials Pick Up
The CRB RIND index has bounced a bit (Figure 6).
Made up of a range of raw materials – from tallow and copper scrap to wool tops and rubber – the index is non-speculative, tracking the spot price of heavily used but infrequently talked about commodities. Without the speculative element, and given the importance of these commodities to the global economy, the index can be seen as an indicator of activity and real supply and demand. The indicator has also previously acted as a leading indicator for equities (Figure 7), anticipating falls in 2008, 2011, 2014 and 2015, and recoveries in 2009 and 2016.
Currently, about 70% of the index’s components are on the up, demonstrating a broad uptick in commodity demand rather than a narrow spike in specific commodities (Figure 8). Historically our conclusion would be tentative optimism, and indeed, we will continue to watch to see if the recovery continues, confirming some path to improving economic activity. We are conscious, however, that the breaks to supply chains are unprecedented, and as such it is possible that this reflects supply constraints, more than anything else.
Figure 6. CRB RIND Index
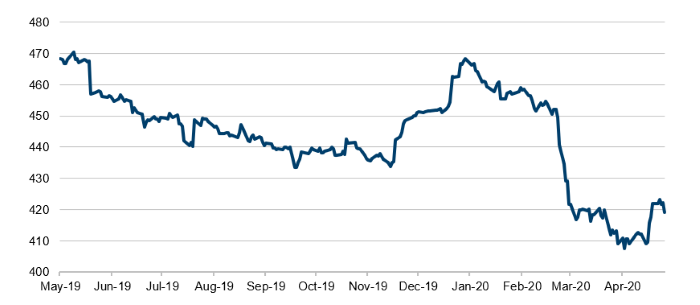
Source: Bloomberg; as of 15 May 2020.
Figure 7. CRB RIND Has Notably Led on a Few Occasions
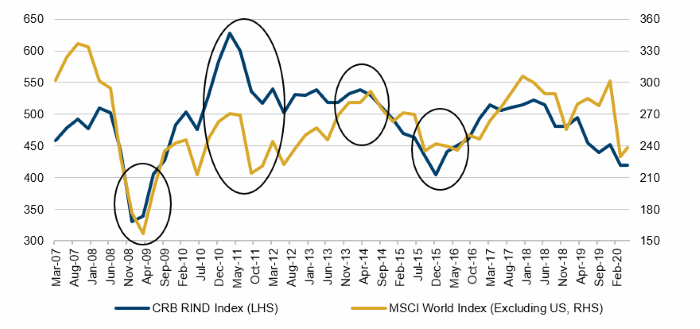
Source: Bloomberg; 15 May 2020.
Figure 8. CRB RIND Breadth Percentage – 50-day average (inverted)
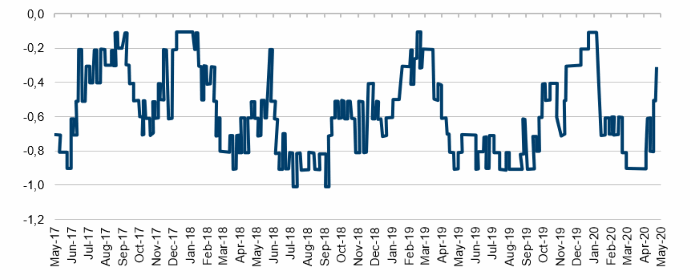
Source: Bloomberg; as of 13 May 2020.
With contribution from: Ben Funnell (Man Solutions, Portfolio Manager) and Ed Cole (Man GLG, Managing Director – Equities).
You are now leaving Man Group’s website
You are leaving Man Group’s website and entering a third-party website that is not controlled, maintained, or monitored by Man Group. Man Group is not responsible for the content or availability of the third-party website. By leaving Man Group’s website, you will be subject to the third-party website’s terms, policies and/or notices, including those related to privacy and security, as applicable.